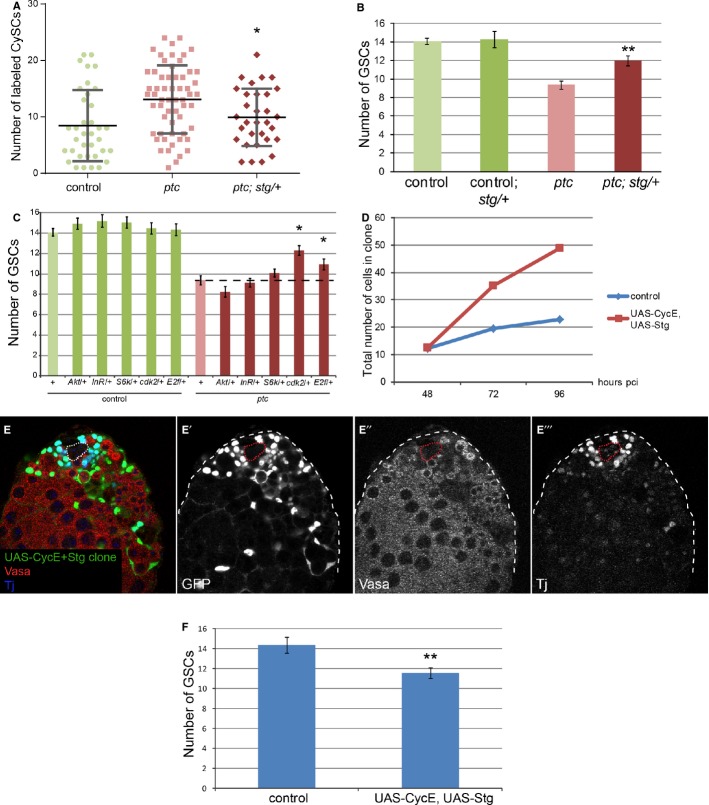
Figure 6. Increased proliferation downstream of ptc is necessary and sufficient for colonizing behavior.
A, B Loss of one copy of stg suppressed the ptc mutant phenotype at 14 dpci. Graph showing number of labeled CySCs in the indicated genotypes (A). Lines in (A) show mean and standard deviation. n = 36 (control), 59 (ptc), 31 (ptc; stg/+). Graph showing the number of GSCs when CySC clones were present in the indicated genotype (B). Asterisks denote statistically significant change from the ptc mutant clones alone (A, B). n = 48 (control), 10 (control; stg/+), 49 (ptc), 17 (ptc; stg/+). Error bars in (B) denote SEM.
C Graph showing the number of GSCs when CySC clones were present in the indicated genotypes at 14 dpci. An asterisk indicates statistically significant suppression of the ptc mutant phenotype. n = 48 (control), 25 (control; Akt/+), 21 (control; InR/+), 30 (control; S6k/+), 19 (control; cdk2/+), 21 (control, E2f/+), 49 (ptc), 21 (ptc; Akt/+), 30 (ptc; InR/+), 35 (ptc; S6k/+), 28 (ptc; cdk2/+), 30 (ptc, E2f/+). Error bars denote SEM.
D Graph showing the total number of labeled cells within control clones (blue line) or clones overexpressing UAS-CycE + UAS-Stg (red line) at 48, 72, and 96 h pci. n = 21, 21, and 26 for control at 48, 72, and 96 h pci, respectively. n = 6, 12, and 15 for UAS-CycE+UAS-Stg at 48, 72 and 96 h pci, respectively.
E Clonal overexpression of CycE and Stg caused CySC overproliferation and GSC loss. Clones are labeled by GFP expression (green, single channel E’), Vasa (red, single channel E”) marks germ cells, and Tj (blue, single channel E’“) marks the somatic lineage. The hub is indicated by a dotted line.
F Quantification of GSC loss in the presence of CycE+Stg overexpressing CySC clones. Asterisks denote statistically significant difference from control. n = 15 and 22 for control and UAS-CycE, UAS-Stg, respectively. Error bars denote SEM.

