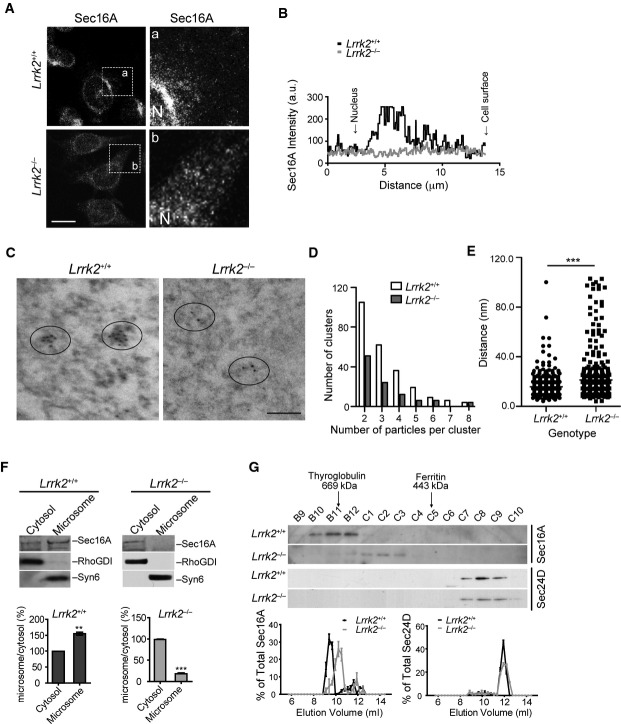
Figure 2. The subcellular distribution of Sec16A is altered in LRRK2-deficient cells.
A, B Immunostaining of Sec16A in immortalized fibroblasts derived from Lrrk2+/+ and Lrrk2−/− mice (A). Images in a/b are of a high magnification from the boxed areas. N marks the location of nucleus. The line graph shows the distribution of Sec16A signal intensity from the edge of nucleus to the cell periphery. Scale bar: 10 μm.
C–E Immuno-EM shows Sec16A distribution in Lrrk2+/+ and Lrrk2−/− fibroblast cell lines (C). Ellipses encircle Sec16A-positive particles. Bar graph shows the distribution of Sec16A-positive clusters with two or more particles in Lrrk2+/+ and Lrrk2−/− cells (D). P < 0.05. Scatter plot depicts the shortest distance between two adjacent Sec16A-positive particles in Lrrk2+/+ and Lrrk2−/− cells (E). ***P < 0.001.
F Western blot analyses show Sec16A in the cytosol and membrane fractions of 1-month-old Lrrk2+/+ and Lrrk2−/− mouse brains. Rho GDP dissociated inhibitor (RhoGDI) and syntaxin 6 (Syn6) were used as the markers for the cytosol and membrane fractions, respectively. Bar graphs show the ratio of Sec16A in membrane versus cytosol fractions. Data are presented as means ± SEM for three independent experiments. **P < 0.01, ***P < 0.001.
G Fast protein liquid chromatography (FPLC) analyses of Sec16A and Sec24D in 1-month-old Lrrk2+/+ and Lrrk2−/− mouse brain extracts. Line graphs show the distributions of Sec16A and Sec24D in each elute versus the sum of total elutes.
Source data are available online for this figure.

