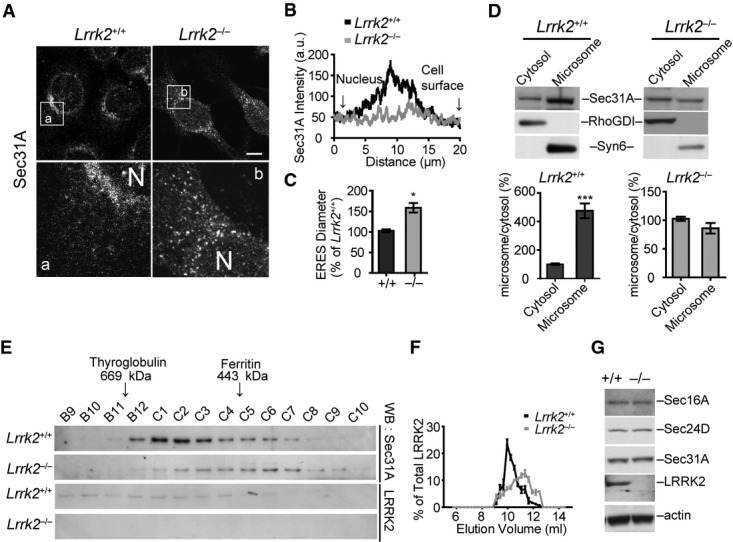
Figure 3. The subcellular distribution of COPII protein Sec31A is altered in Lrrk2-deficient cells.

A–C Immunostaining of Sec31A in Lrrk2+/+ and Lrrk2−/− primary fibroblasts (A). Bottom panels show the enlargement of the boxed areas in the top panels. N indicates the location of the nucleus. Scale bar: 10 μm. Line graph shows the distribution of Sec31A signal from the edge of nucleus to the cell periphery (B). Bar graph depicts the diameter of Sec31A-positive puncta in Lrrk2+/+ and Lrrk2−/− cells (C). Data are presented as means ± SEM. 10–15 cells were analyzed for each genotype. *P < 0.05.
D Western blot analyses of Sec31A in the cytosol and microsome fractions of Lrrk2+/+ and Lrrk2−/− mouse brains. RhoGDI and Syn6 were used as the marker for the cytosol and microsome fractions, respectively. Bar graphs show the ratio of Sec31A in the microsome fraction versus the cytosol fraction. Data are presented as means ± SEM for three independent experiments. ***P < 0.001.
E, F FPLC analysis of Sec31A in Lrrk2+/+ and Lrrk2−/− mouse brain extracts (E). Line graph shows the distributions of Sec31A in each elute versus the sum of total elute (F).
G Western blots show Sec16A, Sec24D, Sec31A, LRRK2 expression in the whole-brain extracts of 1-month-old Lrrk2+/+ and Lrrk2−/− mice. The expression of actin was used as the loading control.
Source data are available online for this figure.
