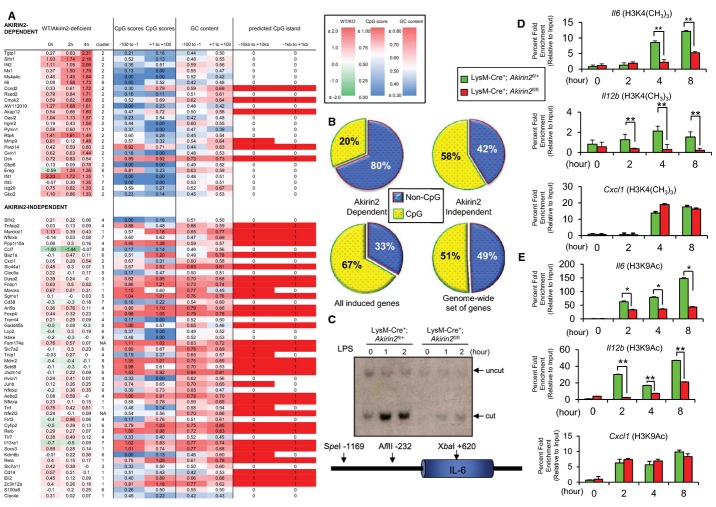
Figure 4. Classification of LPS-induced Akirin2-dependent and Akirin2-independent genes.
A 73 genes that are potently induced by LPS in mouse peritoneal macrophages are shown. Columns 2 to 4 show the difference (log2 ratios) in expression between LysM-Cre+; Akirin2fl/+ and LysM-Cre+; Akirin2fl/fl macrophages, for time points 0, 2, and 4 h. Column 5 shows the cluster index assigned by hierarchical clustering (see Fig 3E). Columns 6, 7 and 8, 9 show the CpG scores and GC content in the regions from −100 to −1 and from +1 to 100 relative to the transcription start sites. Column 10 and 11 show whether a CpG island is predicted (1) or not (0) within the regions −10 kb to +10 kb and −1 kb to +1 kb. Colors reflect the difference in gene expression, the CpG scores, and the GC content, as indicated in the respective color legends.
B These genes were further classified as Akirin2 dependent (lower frequency of CpG islands) and Akirin2 independent (higher frequency of CpG islands) genes. The pie charts show the fraction of genes associated with CpG islands on the region −1 kb to +1 kb for Akirin2-dependent and Akirin2-independent genes, as well as the entire LPS-inducible genes and genome-wide set of genes.
C Restriction enzyme accessibility assay was used to monitor LPS-induced nucleosome remodeling at the Il6 promoter. PECs from LysM-Cre+; Akirin2fl/+ and LysM-Cre+; Akirin2fl/fl were treated with LPS (100 ng/ml) for the indicated time period. Isolated nuclei were digested with AflII, and the cleaved DNA was analyzed by Southern blot using Il6 promoter-specific probe.
D, E ChIP experiments were performed with chromatin prepared from LysM-Cre+; Akirin2fl/+ and LysM-Cre+; Akirin2fl/fl PECs treated with or without LPS (1 μg/ml) for indicated time period. Antibody against trimethyl-histone (H3K4(CH3)3) (D) and acetylated histone (H3K9Ac) (E) was used. Precipitated DNA was quantified by real-time PCR using primers specific for Il6, Il12b, or Cxcl1 promoter region. ChIP values were normalized against the input and expressed as relative enrichment of the material precipitated by the indicated antibody on specific promoter (relative quantification using the comparative Ct method (2−ΔΔCt)). Error bars indicate mean ± s.d. The results are representative of at least three independent experiments. Statistical significance was determined using the Student’s t-test. *P < 0.05; **P < 0.01.

