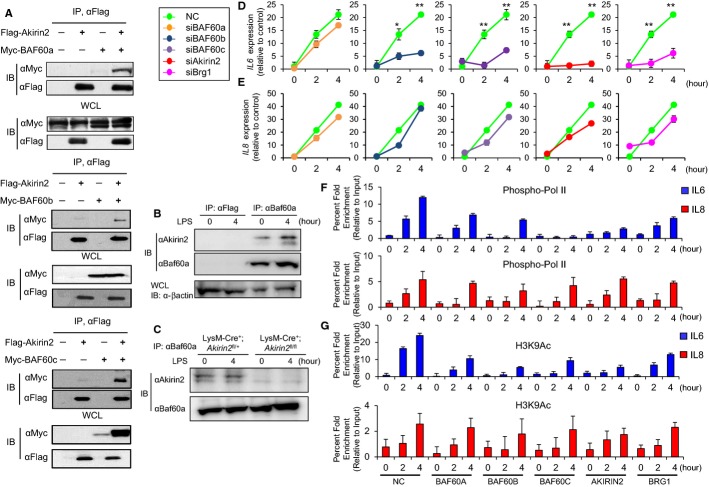
Figure 5. SWI/SNF components are required for the expression and histone modification of the IL6, but not IL8, promoter in response to IL-1β stimulation.
A Cell lysates prepared from HEK293 cells transfected with indicated expression plasmids were immunoprecipitated with anti-Flag antibody, followed by immunoblot analysis using anti-Myc and anti-Flag antibodies.
B PECs from LysM-Cre+; Akirin2fl/+ mice were treated with LPS (1 μg/ml) for 4 h. Cell lysates were collected and subjected to immunoprecipitation using anti-Flag and anti-BAF60a, followed by immunoblot with anti-Akirin2 and anti-BAF60a antibodies.
C PECs from LysM-Cre+; Akirin2fl/+ and LysM-Cre+; Akirin2fl/+ mice were treated with LPS (1 μg/ml) for 4 h. Cell lysates were collected and subjected to immunoprecipitation using anti-BAF60a, followed by immunoblot with anti-Akirin2 and anti-BAF60a antibodies.
D, E HeLa cells knocked down with indicated siRNAs as shown in Supplementary Fig S8A were stimulated with recombinant human IL-1β (10 ng/ml) for indicated time period. Cells were harvested for RNA isolation, and cDNA was subjected to quantitative PCR analysis for gene expression of IL6 (D) and IL8 (E). Samples were normalized using 18S rRNA.
F, G HeLa cells knocked down with siRNAs for indicated genes were stimulated with recombinant human IL-1β (10 ng/ml) for indicated time period. Cells were fixed, chromatin was prepared, and ChIP experiments were performed. Antibodies against phospho-RNA Pol II (S5P) (F) and Histone H3 (acetyl K9) (G) were used. Precipitated DNA was quantified by real-time PCR using primers specific for IL6 or IL8 promoter region.
Data information: ChIP values were normalized against the input and expressed as relative enrichment of the material precipitated by the indicated antibody on specific promoter (relative quantification using the comparative Ct method (2−ΔΔCt)). Error bars indicate mean ± s.d. The results are representative of at least three independent experiments. Statistical significance was determined using the Student’s t-test. *P < 0.05; **P < 0.01.
Source data are available online for this figure.

