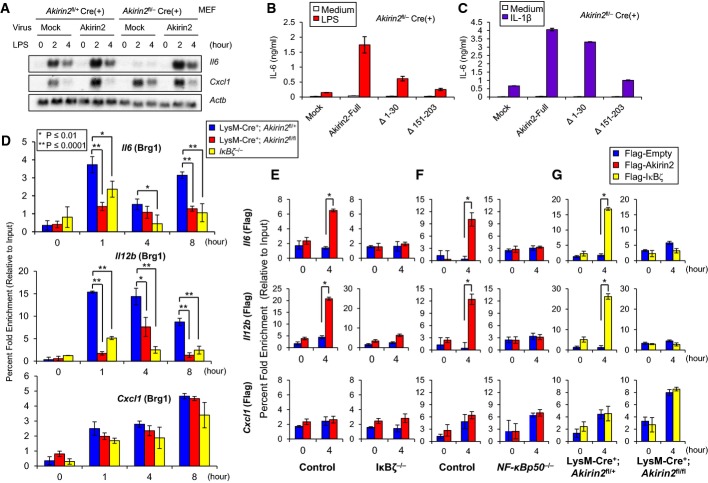
Figure 7. The IκB-ζ-Akirin2 cascade is critical for the recruitment of Brg1 to the Il6 promoter for transactivation.
A MEFs from Akirin2fl/+ and Akirin2fl/− mice were infected with retrovirus expressing Cre and/or full-length Akirin2. Then, the cells were stimulated with LPS (1 μg/ml) followed by Northern blot analysis with indicated probes.
B, C MEFs from Akirin2fl/− mice were infected with retrovirus expressing Cre and indicated Akirin2 mutants. Then, the cells were stimulated with LPS (1 μg/ml) (B) and IL-1β (10 ng/ml) (C), and the production of IL-6 was determined by ELISA.
D ChIP experiments were performed with chromatin prepared from LysM-Cre+; Akirin2fl/+, LysM-Cre+; Akirin2fl/fl and IκB-ζ−/− PECs treated with or without LPS (1 μg/ml) for indicated time period. Antibody against Brg1 (J1) was used. Precipitated DNA was quantified by real-time PCR using primers specific for Il6, Il12b, or Cxcl1 promoter region.
E, F Retrovirally transduced IκB-ζ−/− (E) and NF-κBp50−/− (F) BMDM expressing Flag-tagged Akirin2 were then stimulated with LPS (1 μg/ml) for 4 h, and ChIP experiments were performed. Antibody against anti-Flag was used. Precipitated DNA was quantified by real-time PCR using primers specific for Il6, Il12b, or Cxcl1 promoter region.
G BM cells from LysM-Cre+; Akirin2fl/+ and LysM-Cre+; Akirin2fl/fl mice were infected with retrovirus expressing Flag-tagged empty or full-length IκB-ζ. BMDM were then stimulated with LPS (1 μg/ml) for 4 h, and ChIP experiments were performed. Antibody against anti-Flag was used. Precipitated DNA was quantified by real-time PCR using primers specific for Il6, Il12b, or Cxcl1 promoter region.
Data information: ChIP values were normalized against the input and expressed as relative enrichment of the material precipitated by the indicated antibody on specific promoter (relative quantification using the comparative Ct method (2−ΔΔCt)). Error bars indicate mean ± s.d. The results are representative of at least two independent experiments. Statistical significance was determined using the Student’s t-test. *P < 0.05; **P < 0.01.

