
Figure 6. Mfn2 is regulated at transcriptional level in excitotoxicity.
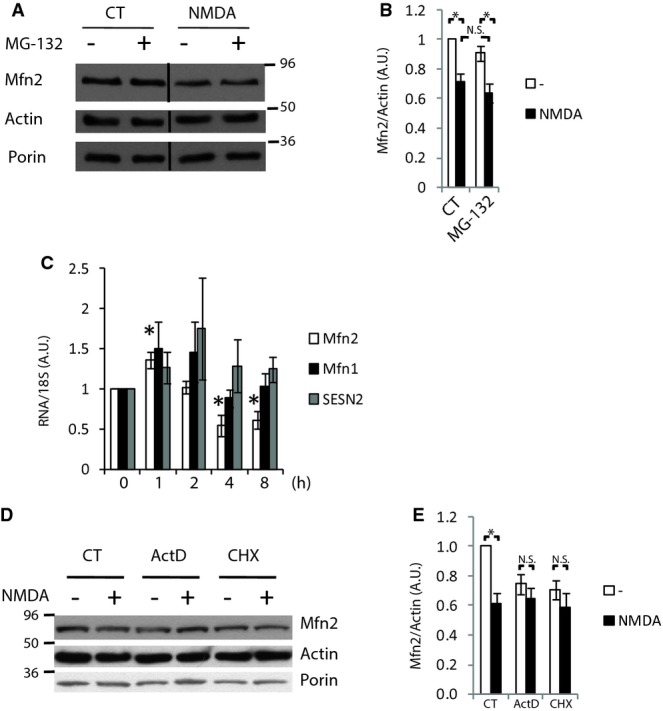
A, B Cortical neurons with or without pre-incubation with proteasome inhibitor MG-132 (10 μM) were treated for 4 h with NMDA (30 μM), and Mfn2 levels were analyzed by Western blot. Densitometric analysis is shown in (B) (n = 7). Results are presented as mean ± SEM. *P < 0.05, one-way ANOVA followed by Bonferroni’s post hoc test.
C–E Cortical neurons were treated with NMDA (30 μM) for the indicated times, and mRNA expression was determined by real-time qPCR (n = 4). *P < 0.05, two-tailed t-test. Cortical neurons were treated with transcriptional inhibitor actinomycin D, translational inhibitor cycloheximide, and NMDA (30 μM) for 4 h as indicated, and Mfn2 protein expression was analyzed by Western blot. Representative Western blot and densitometric analysis are show in (D) and (E), respectively (n = 4). Results are presented as mean ± SEM. *P < 0.05, two-tailed t-test.
Source data are available online for this figure.