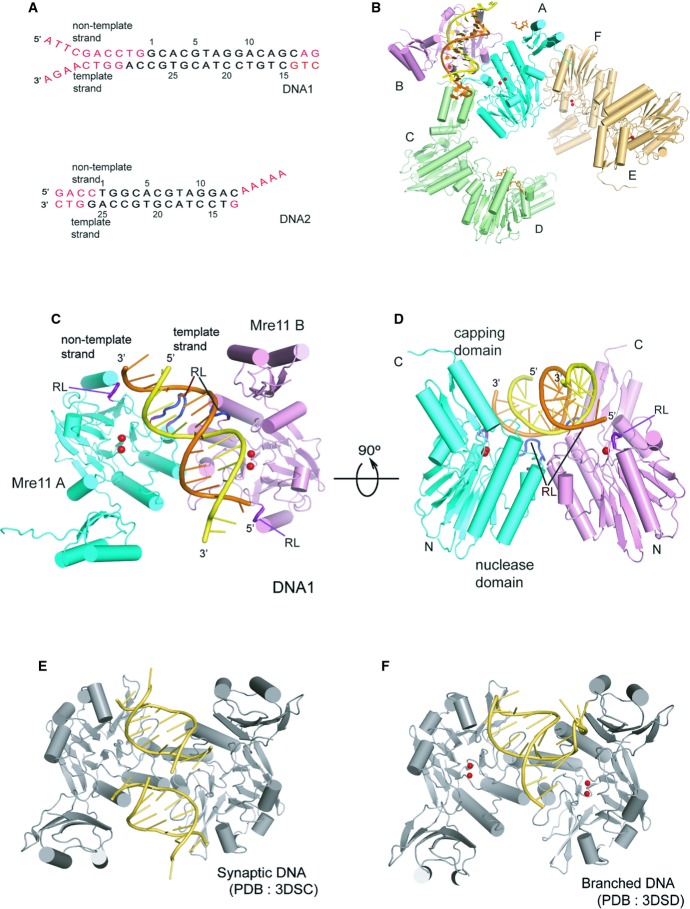
Figure 1. Schematic diagram of the overall structure of the DNA–MjMre11 complex.
A DNA substrates used in the co-crystallization with MjMre11. The disordered region is shown in red. Top and bottom strands are marked as “non-template strand” and “template strand”, respectively.
B Schematic ribbon diagram of the asymmetric unit of the MjMre11–DNA1 complex. The overall structure of the asymmetric unit of the MjMre11–DNA2 complex is virtually identical. The DNA-binding Mre11 A and B are shown in cyan and pink, respectively. The Mre11 C/D dimer and E/F dimer are shown in green and gold, respectively. For a close-up view, see Supplementary Fig S2.
C Overall structure of the MjMre11–DNA1 complex. Mre11 A and B are shown in cyan and pink, respectively. DNA is shown in yellow (template strand) and orange (non-template strand). Mg2+ ions are shown as two red spheres. Two recognition loops (RL) that wedge into the central minor groove are shown in dark blue at the center. Two RLs that bind the duplex ends are shown in deep purple. See Supplementary Fig S3A for comparison with the MjMre11–DNA2 interaction.
D An orthogonal view of (C).
E Overall structure of the PfMre11-synaptic DNA complex (PDB: 3DSC). The figure is shown in the same orientation as that of (C) by superimposing Mre11 A on MjMre11.
F Overall structure of the PfMre11-branched DNA complex (PDB: 3DSD).

