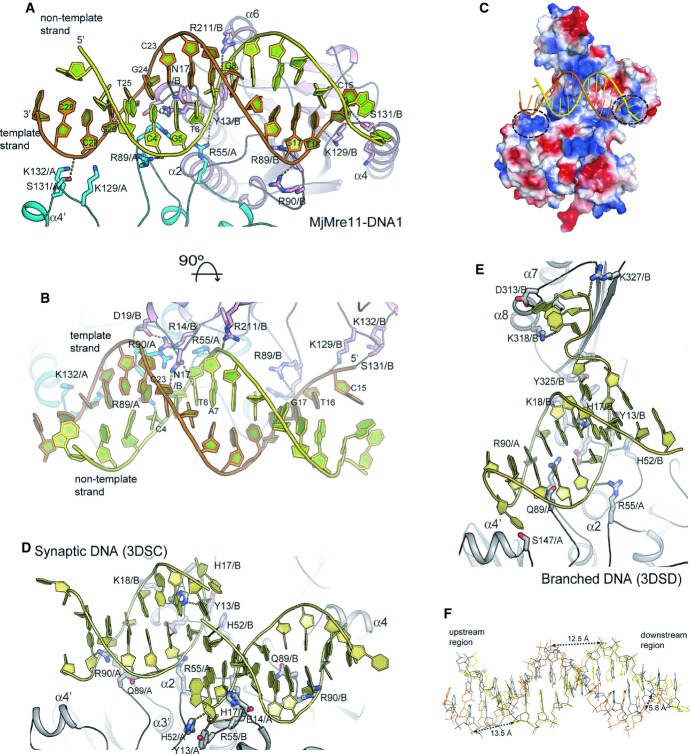
Figure 2. Close-up view of DNA recognition by Mre11.
A Close-up view of MjMre11–DNA interaction. DNA-interacting residues from Mre11 A and Mre11 B are shown in cyan and pink, respectively. See also Supplementary Fig S3C and D for cartoon representations of the MjMre11–DNA1 and Mre11–DNA2 interfaces, respectively. Hydrogen bonds and ion-pairs are shown as dotted lines. An interaction between Ser131 (Mre11B) and the 5′ end of template strand is observed only in Mre11–DNA1.
B An orthogonal view of (A).
C Surface representation of the MjMre11 dimer bound to DNA1 (yellow and orange). Positively and negatively charged regions are shown in blue and red, respectively. A cluster of basic residues including Lys129, Lys130, and Lys132 on each Mre11 molecule is marked with a dashed circle.
D Close-up view of the PfMre11-synaptic DNA interaction (3DSC). The figure is drawn in the same orientation as that of (A).
E Close-up view of the PfMre11-branched DNA complex (3DSD).
F Structural comparison of DNA1 (yellow and orange) and B-form DNA (blue).

