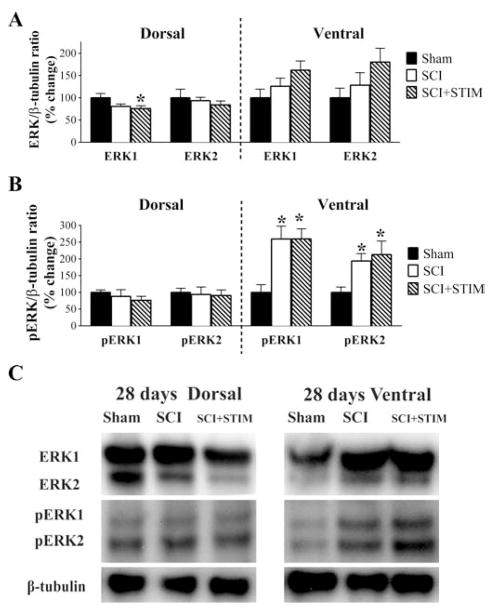
Fig. 7.
ERK and pERK expression at 28 days post treatment
A) Noxious stimulation decreased ERK1 levels in the dorsal spinal cord compared to sham. B) Both pERK1 and pERK2 were increased in the ventral spinal cord of SCI and SCI+STIM subjects, although there were no additional effects of noxious stimulation. [* indicates p < .05 relative to the sham control group]. (C) Examples of representative western blot images for ERK1/2 and pERK1/2. β-tubulin served as a loading control protein.

