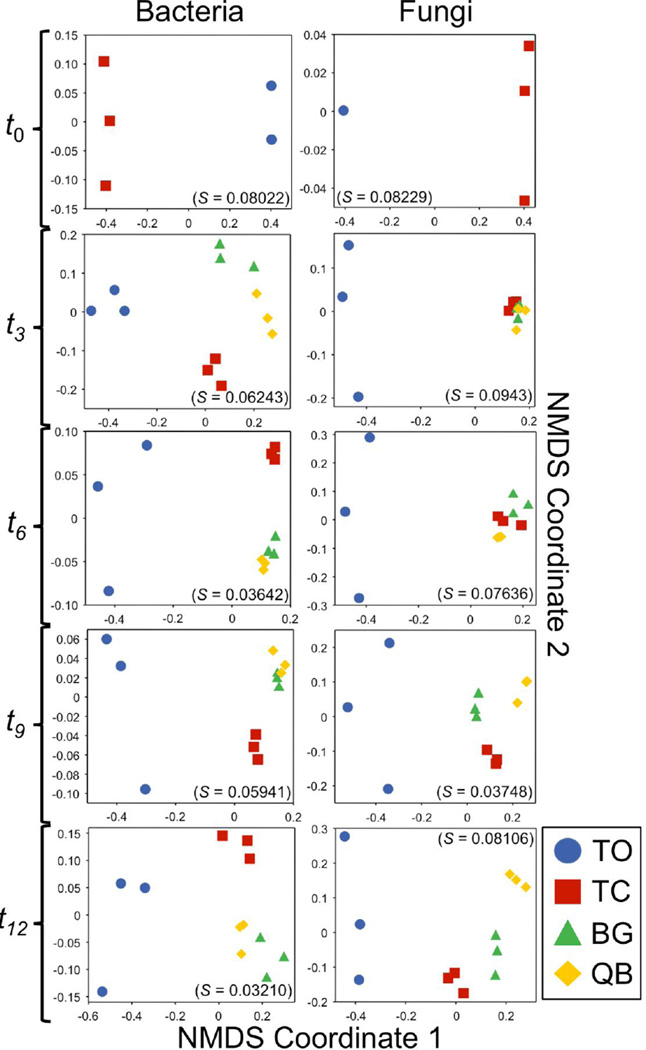
Figure 2.
Non-Metric Multidimensional Scaling (NMDS) ordination diagrams of temporal variations in bacterial (left column) and fungal (right column) community structure. The ordinations are based on Jaccard similarity matrices calculated from the presence/absence data obtained from the DNA fingerprinting analysis. Each scatter point in a plot represents the structure of a microbial community in a particular sample (i.e. mesocosm replicate). The spatial separation between points approximates the similarity between their communities in terms of phylotype composition. All NMDS ordinations showed stress values below the preferred threshold of 0.1.

