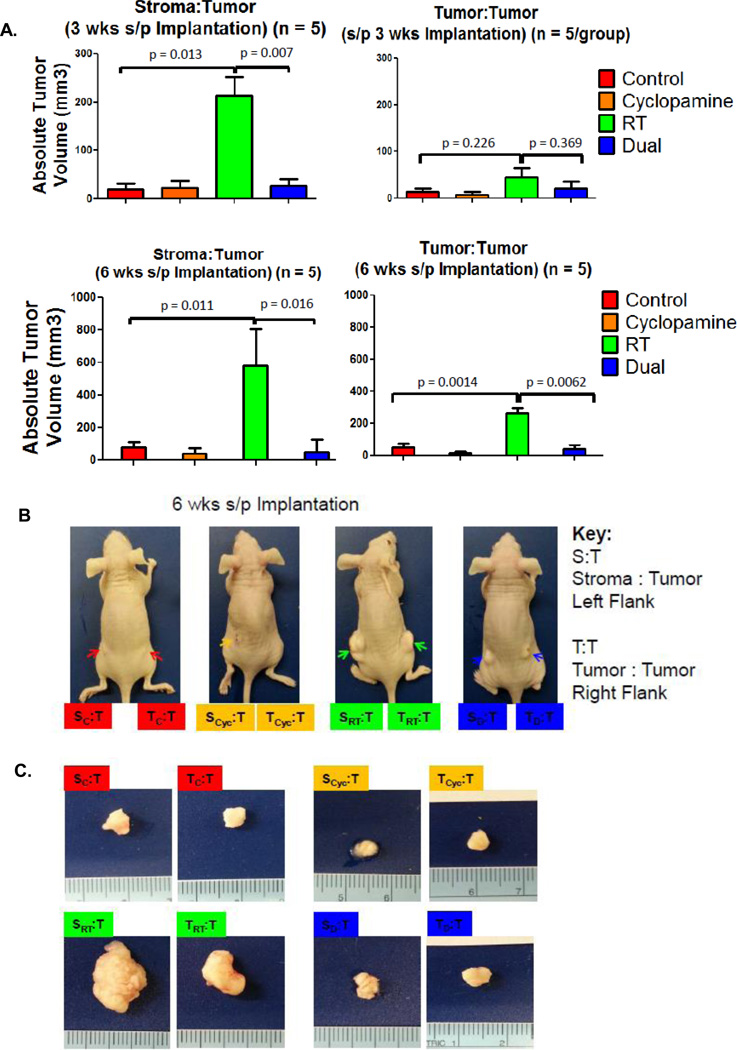
Figure 7. Effect of RT on In Vivo Tumor Repopulation in TU167.
A. All potential flank tumors were measured at 3 (Top) and 6 (Bottom) weeks post-implantation. Stromal:tumor (S:T) and tumor:tumor (T:T) combinations were implanted on the left and right flanks, respectively. B. Labels: Red, Orange, Green, Blue corresponds to pre-treatment control, cyclopamine, RT and dual therapy groups. At 6 weeks post-implantation, final measurements were taken and tumors harvested for analysis. C. Representative excised tumors are shown for each of the four pre-treatment arms with corresponding left and right flank tumors for the two different groups.

