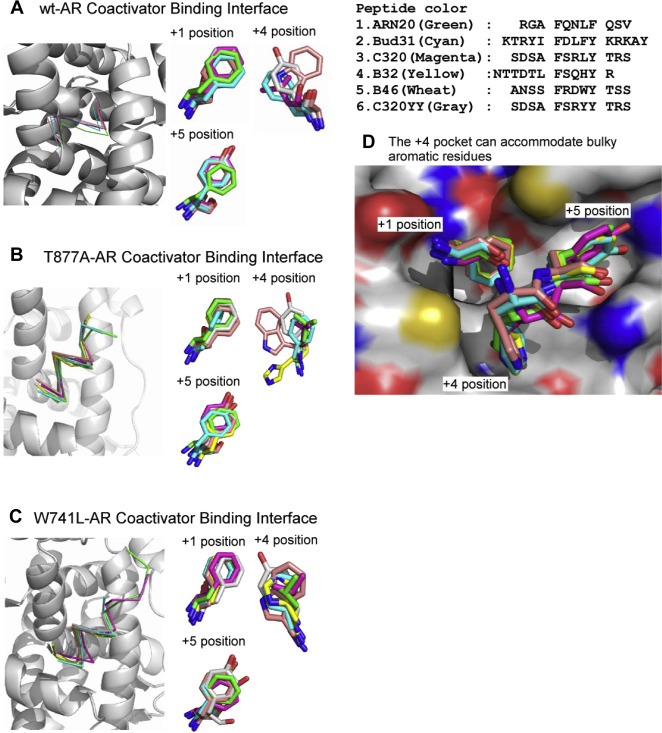
Figure 3.

Structural profiles of AR peptide‐binding interfaces among variants. Cα atoms of the peptides, illustrated as thin stick structures, were superposed onto the AF2 site of the (A) wt‐AR, (B) T877A‐AR, and (C) W741L‐AR proteins, shown as ribbon diagrams. Hydrophobic side chains of the peptides were superposed (right). (D) Various peptides were superposed in the AF2 site. The protein and peptides are shown in surface representation and as thin sticks, respectively. Positively and negatively charged areas are blue and red, respectively. The atoms of nitrogen and oxygen are colored blue and red, respectively.
