
Figure 1.
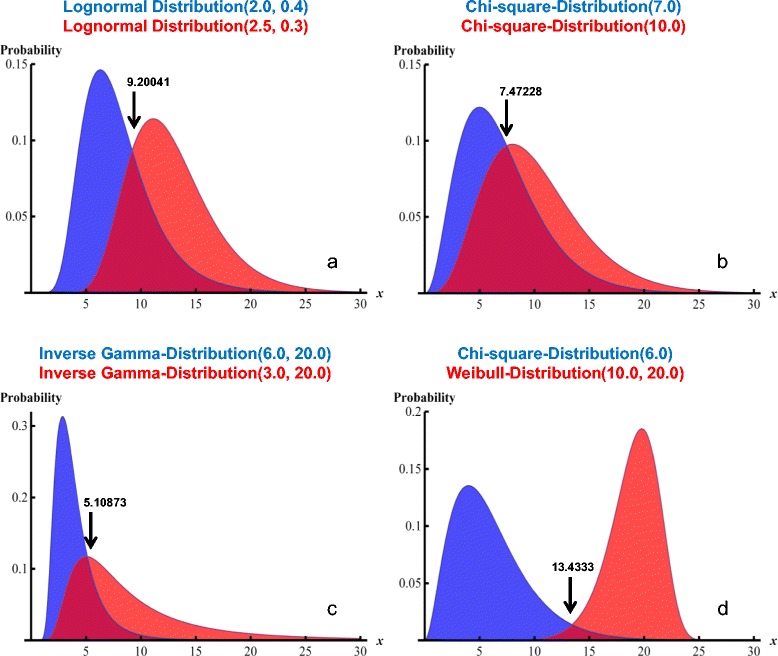
Four different distributional scenarios. The panels a – d show the visualizations of the four scenarios (see Methods section) studied. The distributional characteristics as well as the parameters determining the exact shapes of the distributions are shown in the titles of each panel. Blue: the distributions underlying the “non-diseased” category; red, the distributions underlying the “diseased” category. The arrows point at the crossing points of the distribution functions of the two diagnostic categories, and the numbers associated with arrows are the x-coordinates of these crossing points.