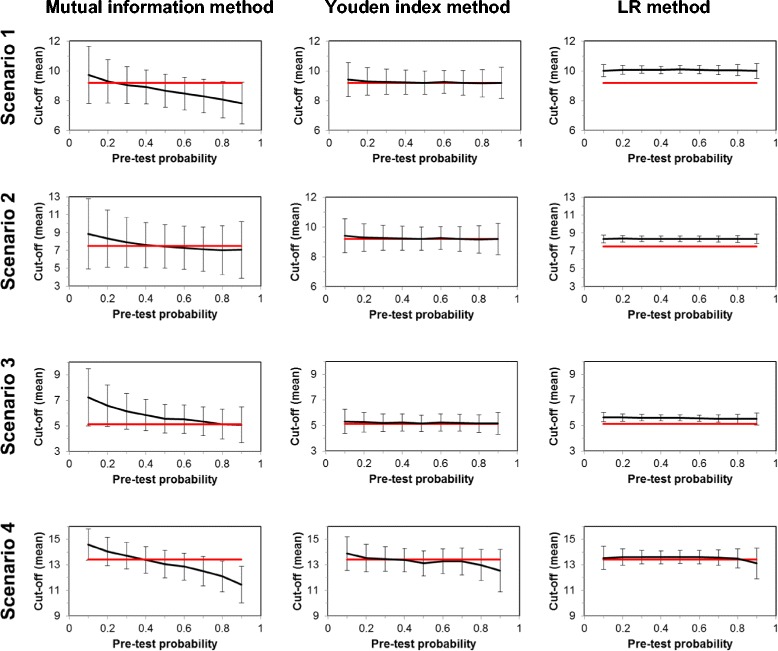
Figure 2.

Bias and precision of the cut-off levels by the three methods in dependence on pre-test probability P(D). For the computations employing sample sizes of 200 fictitious “individuals”, the mean cut-off levels (based on 1000 repetitions each) detected by the three methods are shown together with their SD values in dependence on P(D) (black curves with error bars) and in comparison with the crossing points of the theoretical distribution functions of the two diagnostic categories (red horizontal lines).
