
Figure 3.
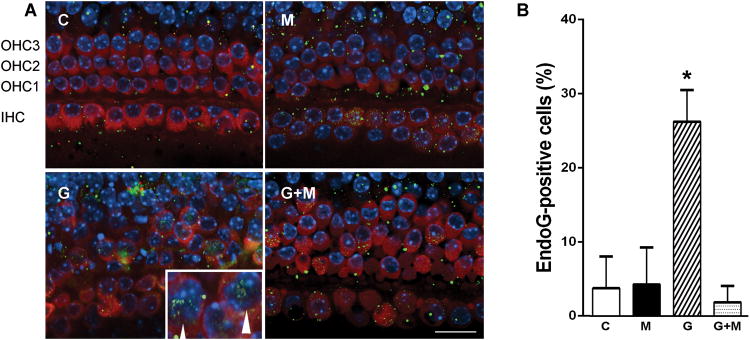
Metformin blocks gentamicin-induced translocation of endoG.
A. EndoG translocated into the nuclei of gentamicin-treated cells (3.5 μM for 72 hours, arrow heads) while little or no translocation of endoG was observed in cells treated with 15 μM metformin alone or metformin in combination with gentamicin. Images are middle sections and representative of 4 to 6 explants per condition. IHC indicates position of inner hair cells, OHC of outer hair cells of rows 1, 2, and 3; respectively. C, control, n =6; M, metformin, n = 4; G, gentamicin, n = 4; G+M, gentamicin + metformin, n = 4. Red: Myo 7a, Green: endoG, Blue: Hoechst 33342. Scale bar = 20 μm. Insert in G shows nuclei at higher magnification with arrow heads pointing to endoG staining.
B. Middle sections of treated explants were quantified for endoG-positive cells and their percentage in each section was calculated and averaged. In each section, between 20and 36 cells could be evaluated, for a total of >100 cells per condition. Data are means+ s.d.; n as in figure 3A. * gentamicin treatment differs from all other conditions, p <0.05; there are no significant differences between metformin or gentamicin plus metformin treatments (One-way ANOVA followed by Student-Newman-Keuls multiple comparisons).