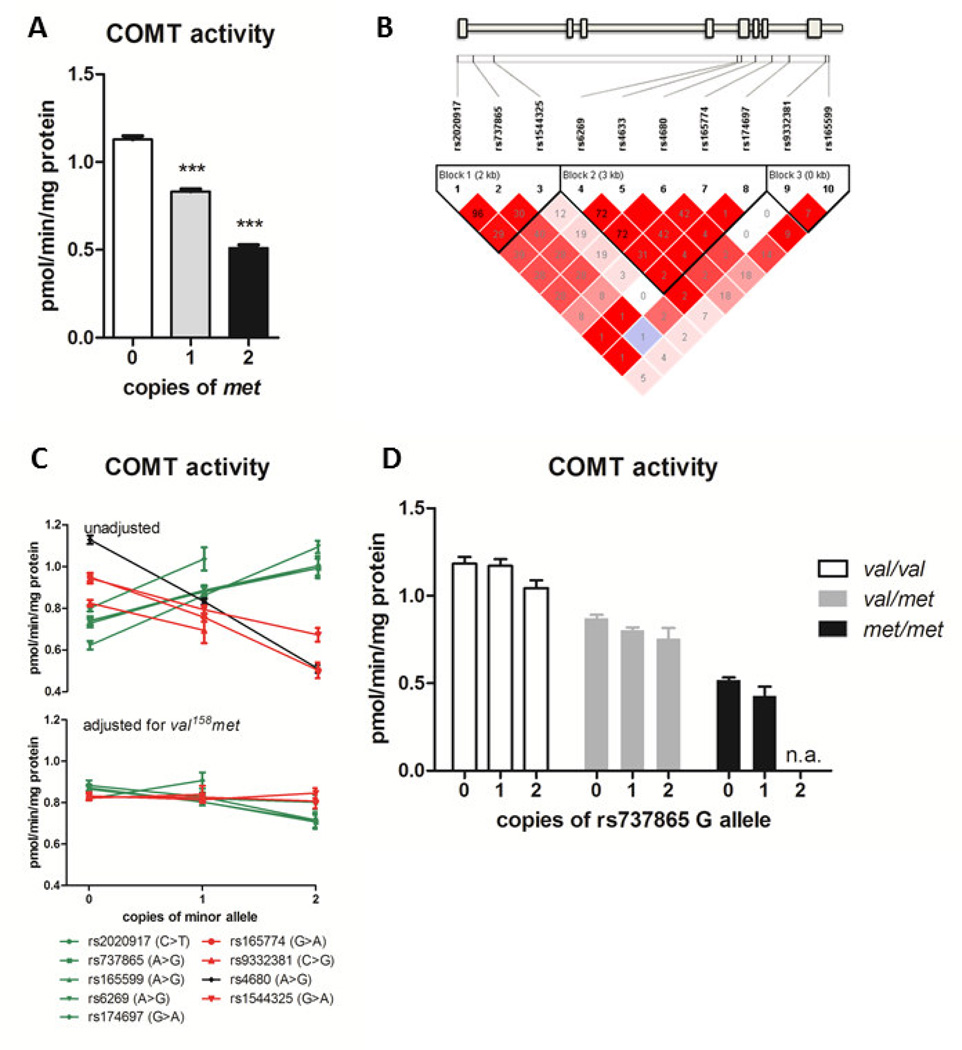
Fig. 1. COMT genotype effects COMT activity.
A. COMT val158met genotype effects COMT activity, such that individuals with 1 or 2 copies of the met allele exhibit reduced activity. Data represent mean ± s.e.m. ***p < 0.0001. B. Linkage disequilibrium plot of the genotyped SNPs in the COMT gene locus. The gene diagram indicates the location of each SNP with respect to exons (boxes) and introns of the gene. The color of each box in the LD plot depicts the strength of LD between aligned SNPs according to D’ (darker red indicates stronger LD), and the number in the box is the corresponding r2 value. C. COMT activity levels of each genotype are shown for all COMT SNPs tested. Symbols and lines are colored green if the respective minor allele is associated with increased COMT activity, and red with decreased COMT activity; the rs4680 val158met is shown in black. In the top panel genotype effects of each SNP are unadjusted; in the bottom panel each SNP effect is adjusted for val158met genotype. D. COMT activity level of each genotype of rs737865, stratified by val158met genotype, shows that the minor G allele of this SNP is associated with decreased COMT activity after the confounding effect of val158met is removed.

