
Figure 2.
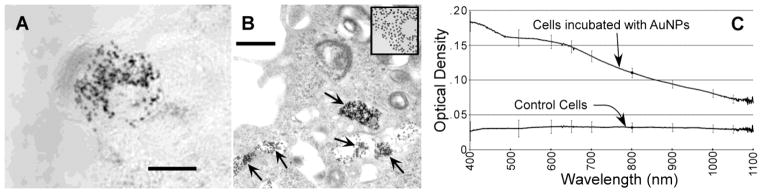
(A) Light micrograph of the in vitro uptake and aggregation of lipoic acid AuNPs in the cytoplasm of one tumor cell. Bar = 10 μm. (B) Higher magnification electron micrograph of a cell after incubation with AuNPs. Aggregation of AuNPs can be seen in the endosomes/lysosomes. Inset at the same magnification shows unaggregated 15 nm AuNPs that exhibit the unaggregated spectrum shown in Figure 1A. Bar = 500 nm. (C) Spectra of cells incubated with or without AuNPs. Cells incubated with AuNPs showed absorption in the NIR region. Error bars are from 6 separate measurements.