
Figure 6.
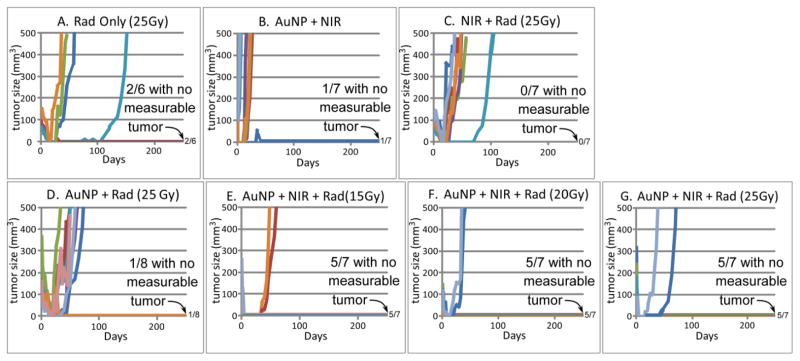
Tumor volume vs. time for various treatments corresponding to Table 1. Survivors that were tumor-free at 250 days are given at the right of the horizontal axes (e.g., 5/7 meaning 5 out of 7 survived with no measurable tumor). Tumor volumes of individual mice are plotted. Each colored line represents one mouse.