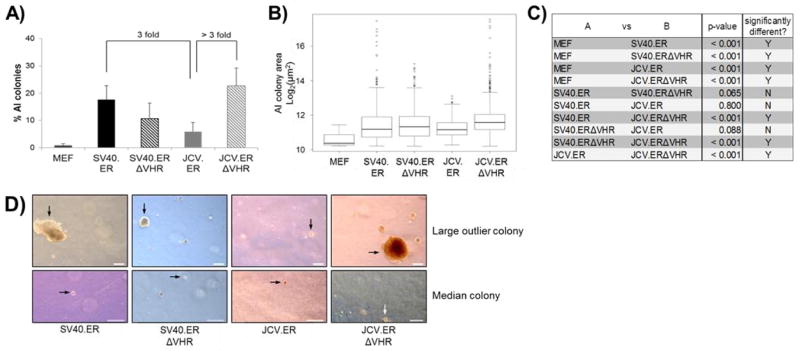
Figure 4. Removal of the VHR in JCV TAg increases anchorage independent colony formation.
Cells expressing different T antigens were suspended in agar medium, allowed to grow for 21 days, and all single cell and multi-cell events were counted and measured as described in methods. A) The number of colonies was divided by the total number of events to produce the percent of AI colonies per experiment. The average percent of AI colony formation for at least two pools expressing the same T antigen is shown (see text). Error bars represent 2 times the standard error of the mean. B) The sizes of AI colonies from all experiments of the indicated cell type were pooled and are shown in box-and-whisker format. The horizontal black line within the box represents the median colony size for each population. Extremely large individual outlier colonies are shown as open circles outside of the whiskers. C) All possible pairs of cell populations from (B) were tested to determine if the distribution of AI colony sizes between the two cell types was significantly different. The p-value from each test is displayed in the table. P-values less than 0.05 were considered significant. D) An image of the largest colony and a median-sized colony for each TAg-expressing population is presented. All images were taken at the same magnification. Images of median sized colonies were digitally magnified to better visualize the colony. Scale bar indicates 200 μm.

