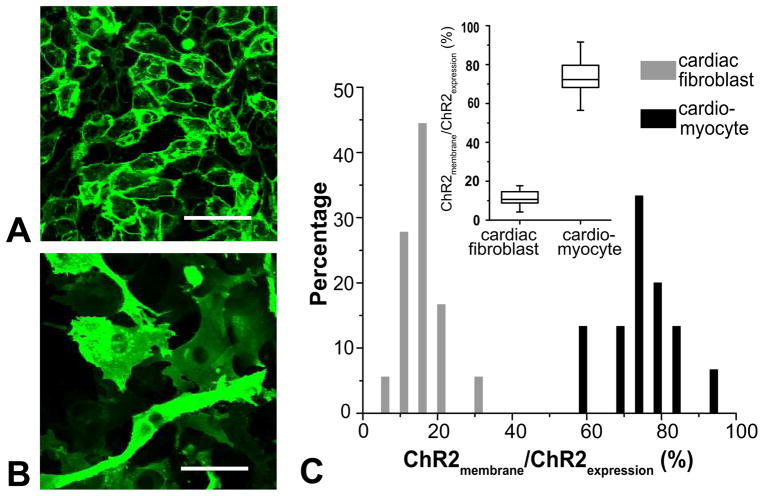
Figure 4. ChR2 expression in cardiomyocytes and cardiac fibroblasts.
A. ChR2-eYFP expression localizes to the cell membrane in cardiomyocytes. B. ChR2-eYFP expression is more diffuse cytoplasmic. C. Quantification of ChR2 expression patterns in cardiomyocytes and fibroblasts; inset is a summary box plot. Line inside box represents median; bars above and below box represents max and min; box represents the 25th and 75th percentile. Scale bars are 50 μm.

