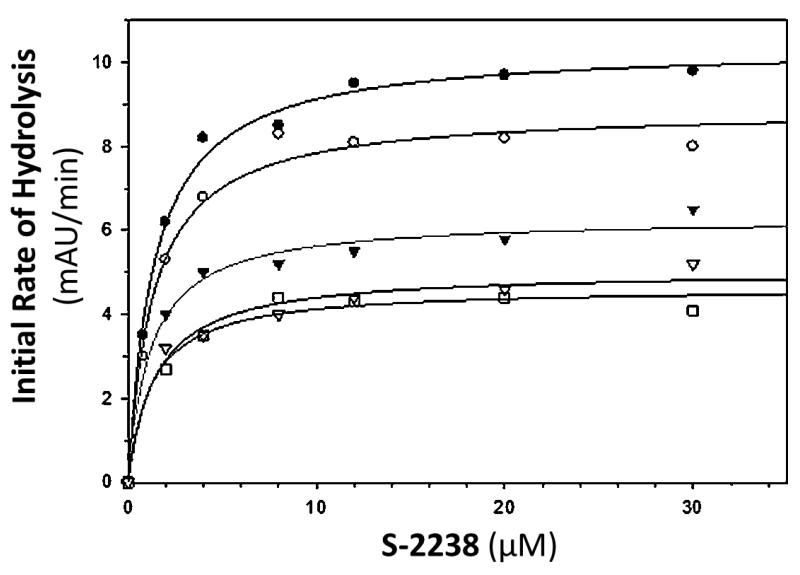
Figure 2.
Michaelis–Menten kinetics of S-2238 hydrolysis by thrombin in the presence of CDSO3. The initial rate of hydrolysis at various substrate concentrations was measured in pH 7.4 buffer as described in Experimental Procedures. The concentrations of CDSO3 chosen in the study were 0 (●), 1 nM (○), 10.5 nM (▼), 30 nM (△), 105 nM (□). Solid lines represent nonlinear regressional fits to the data by the Michaelis–Menten eq 1.

