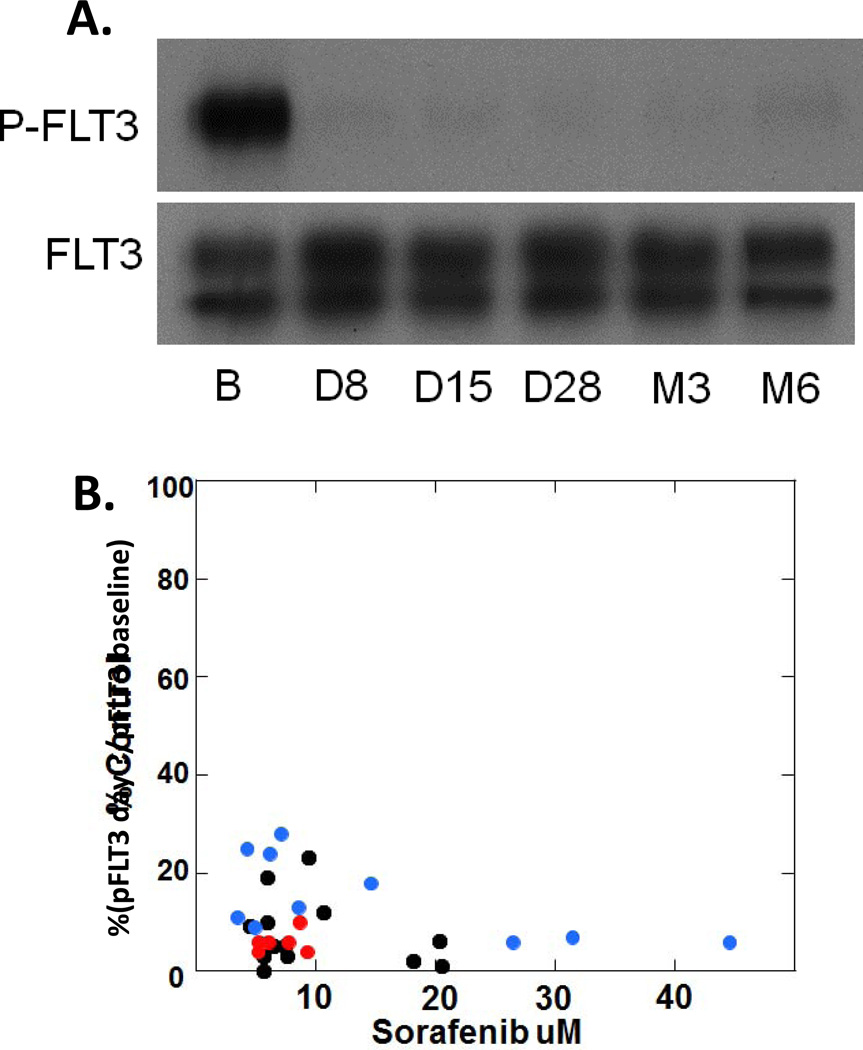
Figure 2.
A. Plasma inhibitory activity (PIA) assay of a patient treated with 200 mg twice daily sorafenib. B = baseline; D = treatment day (e.g., C1D8 = Day 8 of cycle 1); M3 = Cycle 3; M6 = Cycle 6. B. PIA results (expressed as % P-FLT3 at baseline) plotted against plasma sorafenib levels measured from the same time points. The color of the dot denotes the sorafenib dose the patient was receiving at the time of the measurement (not the original cohort assigned). Black dots = 200 mg twice daily; red dots = 400 mg in the AM, 200 mg in the PM; blue dots = 400 mg twice daily. Note that several patients had multiple samples represented at different time points.

