
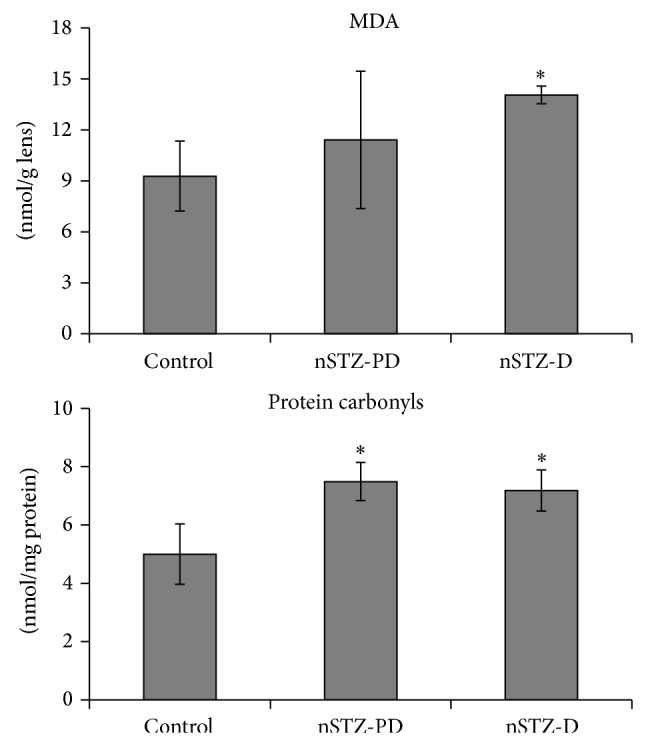
Figure 5.
Lipid peroxidation (MDA) and protein carbonyl content in rat lens. Values are mean ± SD (n = 3). The asterisk denotes that data are significantly different from control group.
Official websites use .gov
A
.gov website belongs to an official
government organization in the United States.
Secure .gov websites use HTTPS
A lock (
) or https:// means you've safely
connected to the .gov website. Share sensitive
information only on official, secure websites.
Lipid peroxidation (MDA) and protein carbonyl content in rat lens. Values are mean ± SD (n = 3). The asterisk denotes that data are significantly different from control group.