Figure 2.

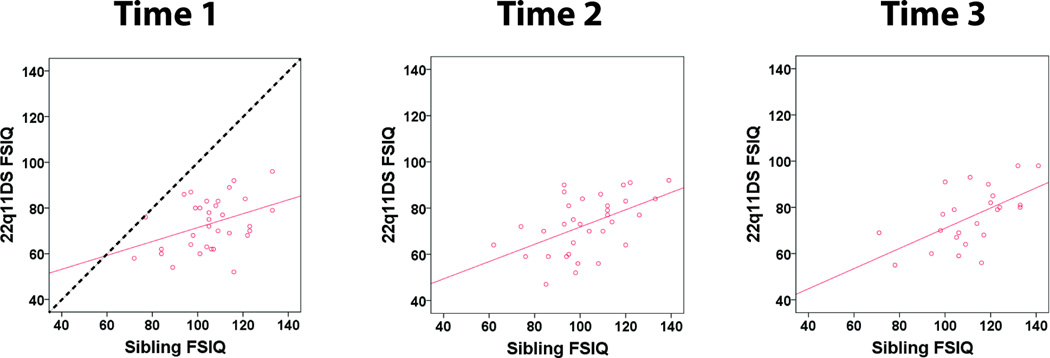
Sibling-22q11DS FSIQ Correlations. The solid lines show linear regressions fitted to the data. The dotted line has a slope of 1.

Sibling-22q11DS FSIQ Correlations. The solid lines show linear regressions fitted to the data. The dotted line has a slope of 1.