
Figure 1. NEFL genotype and gene expression association.
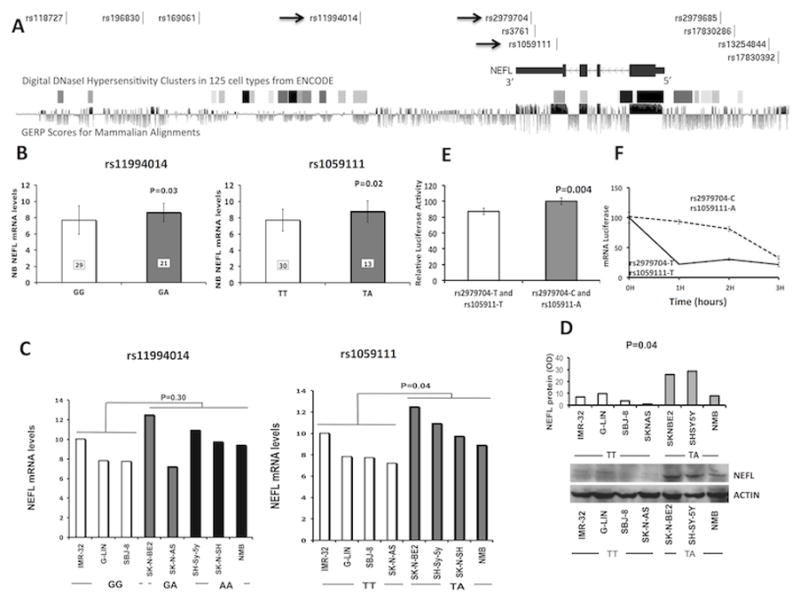
(A) Plot showing NEFL gene and analyzed SNPs. The arrows indicate the SNPs validated in the Italian population. DNase hypersensitive areas in 125 cell types from ENCODE data and GERP score for mammalian alignment (data retrieved from UCSC genome browser, https://genome.ucsc.edu/) are also plotted. (B) Microarray-based expression profiling on primary tumors demonstrates that NEFL expression correlates with rs11994014 (GG: 7.7±1.7 and GA: 8.6±1.1) and rs1059111 genotype (TT: 7.7±1.3 and TA: 8.8±1.3). The genotypes of rs1059111 have been imputed (see Supplementary Information). (C) qRT-PCR (rs11994014 GG: 8.5±1.3; rs11994014 GG/GA: 10.0±1.9; rs1059111 TT: 8.2±1.2; rs1059111 TA: 10.6±1.4) and (D) western blotting (rs1059111 TT: 5.3±3.7; rs1059111 TA: 20.8±11.2) analysis on neuroblastoma cell lines confirms the association between rs1059111 protective genotype and NEFL expression. Data are shown as mean ± standard deviation. (E) Luciferase report gene assay carried out in HEK293 cells confirms the same association (rs1059111 T: 87.1±3.8; rs1059111 A: 100±4.4). Data shown in percentage are the mean ± standard deviation from nine independent transfection experiments, each done in triplicate and compared with promoter less control. (F) Analysis of 3′UTR-allelic mRNA stability in HEK293 cells. The data are presented as the means value ± standard deviation from three independent experiments (P<0.05).