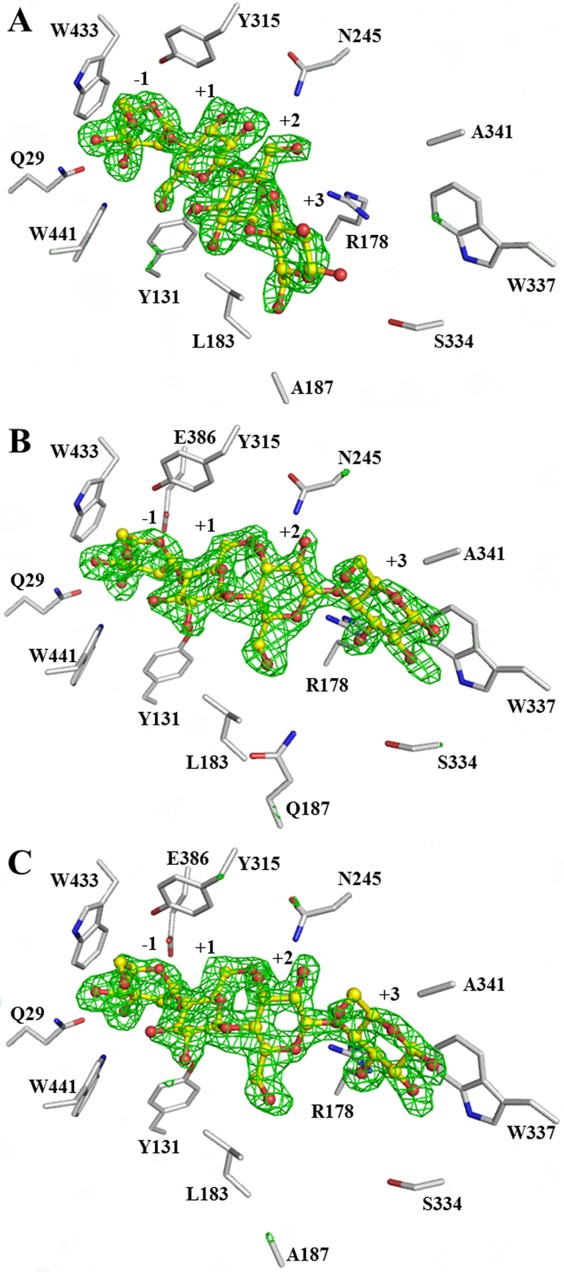
Figure 2.

The Fo − Fc electron density maps for cellotetraose in the active sites of BGlu1 E386G/Y341A/Q187A (A), BGlu1 E176Q/Y341A (B), and BGlu1 E176Q/Y341A/Q187A (C) calculated with the ligand omitted. The omit maps are shown in green mesh at +3σ. The cellotetraose from the final structures are shown in ball and stick representation with carbons colored in yellow and oxygen atoms in red. The sidechains of amino acid residues in the active site are shown with gray carbons. Use this link to access the interactive version of this figure
