
Figure 4.
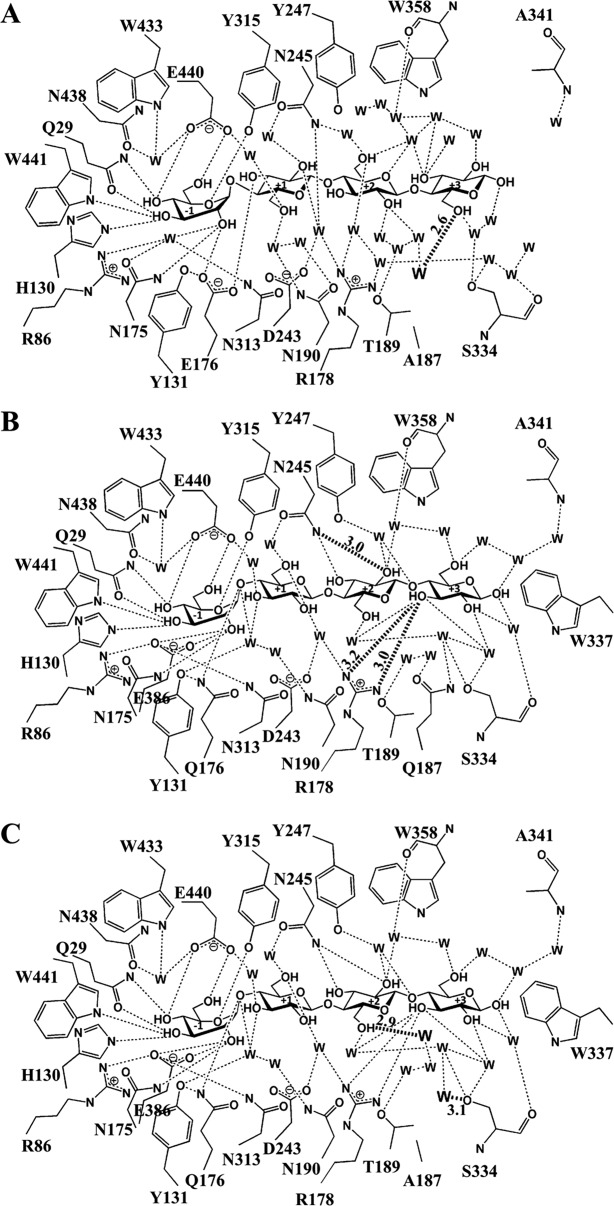
Hydrogen bonds between the glucose residues of cellotetraose, surrounding amino acid residues and the network of water molecules (W) in the active sites of BGlu1 E386G/Y341A/Q187A (A), BGlu1 E176Q/Y341A (B) and BGlu1 E176Q/Y341A/Q187A (C). Hydrogen bonds with measured distances of 3.2 Å or less are shown as dashed lines to indicate the hydrophilic interactions. The diagram in A shows the flip of the glucosyl residues in subsites +1 to +3 that results in a completely different network than to those in the active sites of the BGlu1 E386G and E176Q complexes with cellotetraose. The hydrogen bond between O6 of Glc4 and a water found in the place of the Q187 amide (W) is shown as a darkened dashed line. The diagram in B shows the direct hydrogen bonds with R178 and hydrogen bond from N245 that are shorter than those in the BGlu1 E176Q complex with cellotetraose as darkened dashed lines with their distances in Å marked on the lines. The diagram of BGlu1 E176Q/Y341A/Q187A in C shows similar hydrogen bonds as in B, except for those of the two waters bound in place of Q187 with O6 of Glc3 and S334 Oγ, which are shown as darkened dashed lines.