Abstract
Human IgG2 consists of disulfide-mediated structural isoforms, classified by the number of Fab arms disulfide-linked to the heavy chain hinge. In the IgG2-B isoform, both Fab arms are linked to the hinge region, and in IgG2-A, neither Fab arm are linked to the hinge. IgG2-A/B is a hybrid between these two forms, with only one Fab arm disulfide-linked to the hinge. Within each of these isoform types are subtypes, with subtle disulfide-linkage differences. Here we explored the structural basis for the A1 and A2 isoform subtypes. Whereas A1 isoform converts into the A/B and B isoforms under mild redox conditions, A2 does not. Characterization of the disulfide connectivities of A2 isoform revealed a similar structure to A1 isoform, with parallel inter heavy chain disulfide linkages in the hinge region. However, the hinge disulfides in A2 isoform were resistant to reduction under conditions where A1 isoform hinge disulfides became reduced and they required thermal treatment (>55°C) to obtain thiol-dependent disulfide reduction. Structural analysis of the hinge region indicated that the protected disulfides were restricted to cysteines 219 and 220 of the upper hinge. Disruption of the upper hinge through insertion mutagenesis eliminated A2 isoform behavior. 1H NMR studies showed that the A1 isoform Fc glycan was more dynamic than that on A2 isoform and showed some other conformational differences. Results point to an IgG2-A2 upper hinge region that is more akin to the interior of a globular protein than the flexible hinge region expected on an IgG.
Keywords: NMR, monoclonal antibodies, protein dynamics, disulfide reduction
Introduction
Immunoglobulin G (IgG) consists of two heavy chains (HC) and two light chains (LC) connected by disulfide bonds. In the human immunoglobulin subclass IgG2, one disulfide bond connects each light chain to the heavy chain and four disulfide bonds connect the two heavy chains to each other. Beyond the interchain links, each of the 12 antiparallel globular antibody folds contains an intrachain disulfide bond. While the classical disulfide bond structure was established in the 1960s, more recently other disulfide bonding patterns have been described.1 These alternate structures, or disulfide isoforms, differ in their specific linkages between the Fab arms and the heavy chain hinge region. Classification of the disulfide isoforms has been based on whether the LC:HC interchain links are restricted to the Fab arms or contain the HC hinge region. In the IgG2-A form (A isoform), the cysteine near (λ) or at (κ) the C-terminus of each LC is linked to the Fab arms of the HC. This is the originally described IgG2 disulfide structure. In the IgG2-B structure (B isoform) both Fab arms are disulfide linked to the hinge, and in the hybrid IgG2-A/B structure (A/B isoform), only one Fab arm is disulfide linked to the hinge. Mixtures of these disulfide isoforms exist in recombinant antibody preparations but also in endogenous antibody samples prepared from serum.1,2 Within major disulfide isoform classes, there may be additional linkage heterogeneity subclasses, which are denoted with a subscript number (e.g., B1, B2 isoforms).3
Studies of the IgG2 disulfide isoforms have revealed some interesting differences in their physicochemical properties. In a few cases, disulfide isoforms differ in their specific activity in cell based assays.2 Relatively mild redox conditions can change the distribution of A, B, and A/B disulfide isoforms in vitro. Disulfide isoform conversion occurs in blood in vivo and in vitro under conditions designed to mimic blood redox conditions. In both cases, the relative level of the A disulfide isoform decreased quickly, whereas the A/B isoform decreased slowly and the B isoform increased slowly. The levels of one partially characterized disulfide isoform, termed A* in early studies4 and later termed A2 isoform,5 did not appear to change over time in the in vivo or in vitro experiments. Whether this lack of conversion was due to insensitivity to the redox conditions chosen or because the A2 was at equilibrium at the initial conditions was not determined.
The IgG2 disulfide isoform A2 was originally identified based on its later eluting position on nonreducing but denaturing RP-HPLC chromatograms.4 This peak was present in low but significant levels in all preparations of recombinant IgG2 mAbs and endogenous IgG2s studied to date.2 Peptide mapping of the RP-HPLC A2 isoform peak from a mAb revealed a similar disulfide binding pattern to the A1 disulfide isoform, with no Fab-hinge linkages.4 Besides this seeming insensitivity towards disulfide isoform conversion, little else is known about properties of IgG2-A2. Recently, IgG2-A1 and -A2 enrichments have been achieved through a combination of chromatography steps under native conditions. Interestingly, differences between these two “A” isoforms were observed in activity assays for therapeutic antibodies (Chou, unpublished results). Here we describe biochemical and biophysical studies into the properties of the A2 isoform using enriched IgG2-A2 samples. Sensitivity to disulfide reduction was used to probe for hinge accessibility. In addition, one-dimensional 1H NMR spectroscopic studies using a novel PROFILE approach compared the domain dynamics between the that IgG2 disulfide isoforms. In both studies significant differences were observed between the A2 isoform and other IgG2 disulfide isoforms.
Results
Measuring IgG2-A2 disulfide isoform levels by RP-HPLC
The major disulfide isoforms of human IgG2 can be separated and quantified by RP-HPLC.2 Purified preparations of IgG2 antibodies containing either kappa light chain (IgG2κ) or lambda light chain (IgG2λ) produce four main peaks but their profiles may vary in the intensities of those peaks. Figure 1 presents RP-HPLC chromatographic examples of purified recombinant IgG2 antibodies, which had been secreted from CHO cells and produced under similar conditions. Identification of the labeled peaks was accomplished by nonreduced peptide mapping of samples collected during peak elution.1,5 The IgG2κ example in the Figure 1(a) contains mainly B and A/B isoforms, whereas IgG2λ [Fig. 1(b)] contains mainly A1 and A/B isoforms. Although different mAbs may have slightly different levels of each isoform, different mAbs of the same type (i.e., IgG2κ or IgG2λ) display similar patterns when expressed under similar conditions.2 Myeloma proteins of the IgG2κ and IgG2λ types, isolated from human sera, also display similar RP-HPLC patterns, suggesting similar isoform levels. In all samples tested, both A1 and A2 disulfide isoforms are present. Levels of the A2 isoform typically range from 5 to 10% of the total in these samples.2 IgG2-A2 universally elutes later than the IgG2-A1 isoform with RP chromatography, suggesting that A2 isoform is more hydrophobic under these stringent (75°C, water/acetonitrile) column conditions.
Figure 1.
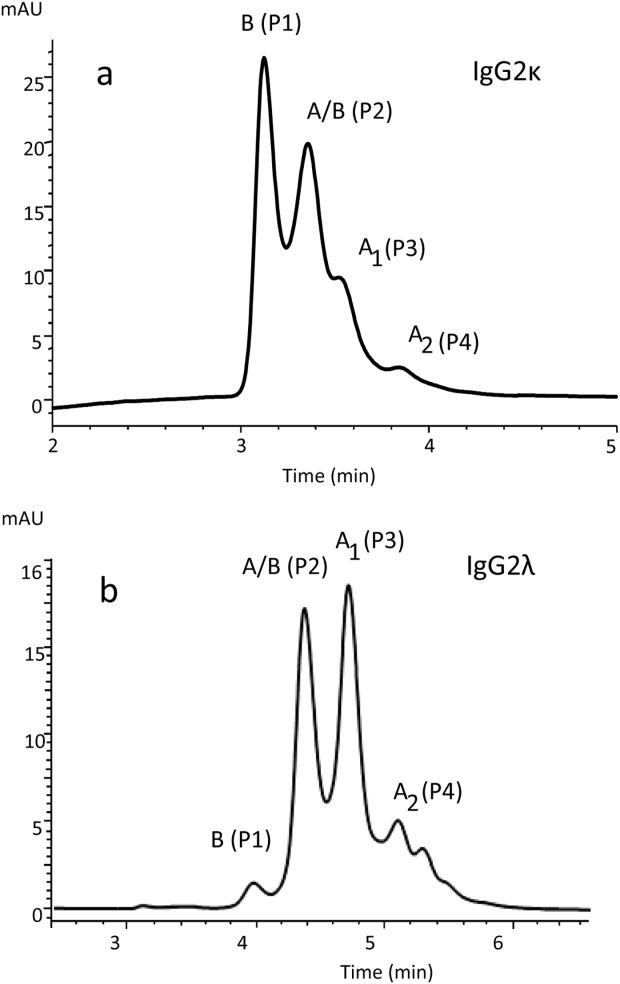
Nonreducing RP-HPLC profiles of an IgG2κ (a, mAbA) and an IgG2λ (b, mAbC).
Disulfide bonding pattern of IgG2-A2
Although the A, B, and A/B disulfide isoforms, when separated by RP-HPLC, could be distinguished from each other by their disulfide bond connectivities, A1 and A2 disulfide isoforms were indistinguishable from each other when analyzed by the same nonreduced peptide mapping technique using MS/MS characterization. Moreover, A1 and A2 isoform hinge peptides generated by Lys-C digestion elute at the same positions in the reversed phase chromatograms and with the same mass.
While the peptide mapping revealed that hinge peptides from A1 and A2 isoforms are IgG2-A in nature, meaning that the disulfide bonded hinge region lacks connections to the Fab arm, this technique by itself could not determine the complete disulfide bonding patterns within the hinge. The combination of peptide mass and lack of NEM-labeling indicated that all the cysteines in the A1 and A2 isoform hinge peptides are disulfide bonded. Previous studies using Edman sequencing have shown that the cysteines in the A1 isoform hinge form contain parallel interchain disulfide linkages, as illustrated in Figure 2(a). Edman sequencing was performed on the disulfide-connected A2 isoform Lys-C hinge peptide, using the A1 isoform hinge peptide as a control. This technique can distinguish the parallel hinge connections, as shown in Figure 2(a), from other possible intrahinge connections. Two of these alternate linkages, with either nonparallel interchain bonds [Fig. 2(b)] or with intrachain connections [Fig. 2(c)] are shown, though others are possible. Sequencing of the structure shown in Figure 2(a) would yield cystine in cycles 1, 2, 5, and 8, whereas sequencing of the structure in Figure 2(b,c) would yield no cystine product in cycle 1, two moles of cystine in cycle 2, and a normal recovery of cystine in cycles 5 and 8. Results of A1 and A2 isoform hinge peptide Edman sequencing are shown in Figure 2(d). Cystine was identified in all cycles containing cysteine in the primary sequence for both A1 and A2 isoforms, and at levels, consistent with parallel interchain linkages. From peptide mapping, MS analyses, and Edman sequencing results, the A2 isoform is, like the A1 isoform, concluded to have a parallel interchain disulfide linkage pattern in its hinge, as shown in Figure 2(a).
Figure 2.
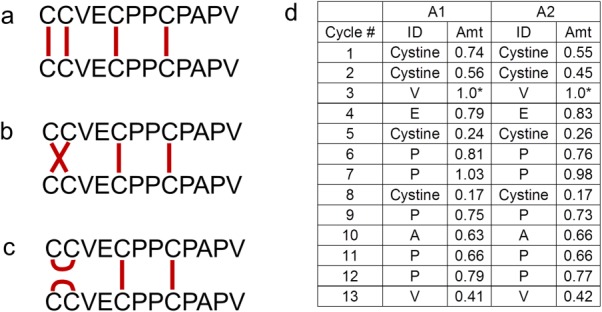
Edman sequencing of A1 and A2 enriched peptides. (a) Hinge structure with parallel hinge connections, (b) hinge structure with nonparallel interchain linkages between the first two cysteines. (c) hinge structure with intrachain linkages between the first two cysteines. (d) Edman sequencing results for the A1 and A2 hinge peptide. ID is given for each PTH-derivatized amino acid in the single letter code, except for cystine. Levels for each amino acid were normalized to the valine in the third cycle within each experiment (A1: 71 pmol; A2: 179 pmol). Since no cystine standard was used, cystine levels are based on the tyrosine standard.
Stability of IgG2-A2 isoforms under physiological conditions
Disulfide isoforms A1, A/B, and B can interconvert under physiological conditions (pH 7.4, 37°C) in the presence of low levels of free thiol containing compounds (e.g., 15–20 µM cysteine).5 A decrease in the relative level of the A1 isoform over time was observed with IgG2κ samples containing either a mixture of disulfide isoforms or enriched in the A1 isoform. However, little change was observed in the A2 disulfide isoform levels in these same samples. Two possible explanations can account for the apparent stability of A2 isoform in these samples. One possibility is that the A2 disulfide isoform is labile under the conditions studied, but is already at equilibrium in the initial conditions. A second possibility is that the A2 isoform is inert under these conditions.
To shift the sample away from a potential equilibrium, the A2 isoform was chromatographically enriched under native conditions (Chou, unpublished results). The enriched mAbA- A2 sample from an IgG2κ antibody was about 70% A2 isoform, as compared to ∼6% A2 isoform in the un-enriched sample. When the mAbA-A2 enriched sample was incubated under conditions that mimic the physiological blood redox environment, no significant change in the A2 isoform levels was observed [Fig. 3(b,d)]. Under these same conditions, large changes could be observed in a mAbA-A1 enriched samples [Fig. 3(a,c)]. Over a few days, A1 isoform levels decreased, while A/B isoform levels and then B isoform levels rose. The results with the A1 isoform enriched samples are as previously reported.5 These results clearly indicated that the A2 isoform is stable under physiological conditions and resists isoform conversion.
Figure 3.
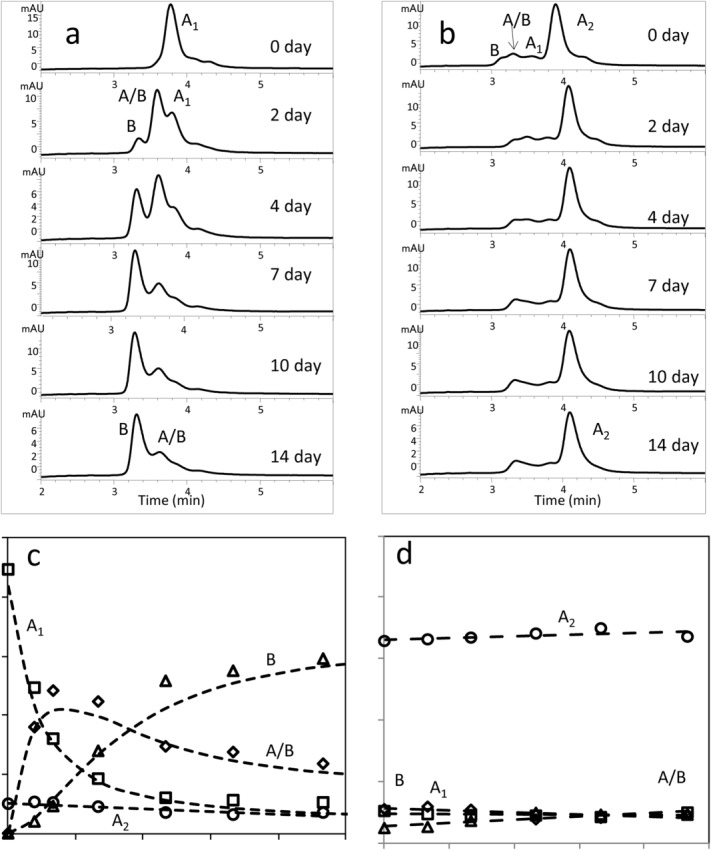
RP-HPLC chromatograms of enriched mAbA A1 (a) and mAbA A2 (b) samples after incubation under physiological conditions. Disulfide isoform level changes over time for mAbA A1 (c) and mAbA A2 (d).
Impact of reducing reagents on IgG2-A2 structure
To probe the sensitivity of the A2 isoform towards reduction, mAbB (IgG2κ) A2 and A1 isoform enriched samples were treated with 2 mM of the thiol reducing reagent DTT for 2 h at ambient temperature. Free thiols in the reaction were then quenched with excess NEM. The degree of interchain disulfide reduction was assessed by denaturing but nonreducing micro fluidic chip-based CE-SDS analysis. Figure 4 shows electropherograms of enriched A1 [Fig. 4(a,b)] and A2 isoforms [Fig. 3(c,d)] samples before and after treatment under these conditions. Although not all the interchain disulfides were reduced in either sample, significant differences in the pattern of reduction were observed. Peptide mapping of the reduced mAbA-A1 sample revealed that most of the intrachain disulfide bonds were still intact, while most of the interchain disulfides were reduced (data not shown). Major peaks in the electropherogram [Fig. 4(b)] were the free LC and HC unlinked to other chains, though low levels of LC linked to HC (HL), HC linked to another HC (HH), and other multichain species were observed. In contrast, the A2 isoform enriched sample [Fig. 4(d)] contained high levels of HH and low levels of unlinked heavy chain (H). These results indicate that LC–HC linkages were broken in both A1 and A2 disulfide isoforms, but hinge disulfides in the A2 remained intact, though this assay cannot distinguish which of four hinge disulfides remain in the A2 isoform hinge region. Incubating A2 isoform enriched samples with increasing DTT concentrations (up to 24 mM) did not significantly lower the HH levels. Similar results were obtained with the mAbA-A2 (also an IgG2κ) enriched sample (data not shown).
Figure 4.
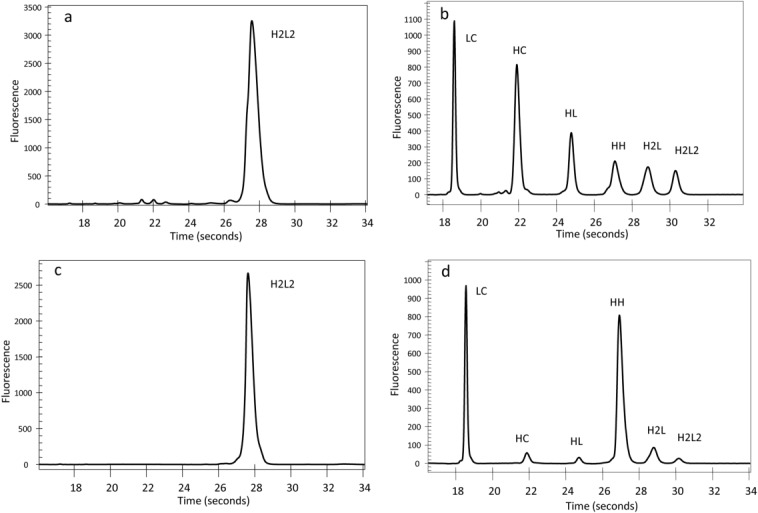
Micro fluidic chip-based CE-SDS electropherograms of nonreduced (a) and reduced (b) mAbB A1 and nonreduced (c) and reduced mAbB A2 (d).
mAbB-A1 and -A2 enriched samples were treated with a series of increasingly stringent conditions by using 2 mM DTT and varying temperature. Nonreduced microfluidic chip-based CE-SDS analyses of samples incubated at temperatures ranging from 25 to 65°C are shown in Figure 5. Little change was observed in the electrophoretic profile of the A1 isoform enriched samples with respect to incubation temperature [Fig. 5(a)]. However, the HH peak size decreased in A2 isoform enriched samples incubated at 55°C and above [Fig. 5(b)]. Figure 5(c,d) plot the percentage of relative peak areas of H and HH versus temperatures for the A1 and A2 isoform enriched samples, respectively. As temperature increased to 55°C, the hinge disulfides on the A2 isoform HH species reduced, generating free HC. These results suggest that the links holding HH together in A2 isoform are reducible bonds and that hinge disulfides could be reduced at 55°C and above [Fig. 5(b)], possibly due to protein denaturation at those temperatures. In contrast, A1 isoform was reduced into LC and HC at all temperatures studied. The small amount of HH in the A1 isoform enriched sample is likely the result of A2 isoform impurity (∼10% A2). The HH loss at 55°C in this sample is consistent with this interpretation [Fig. 5(d)].
Figure 5.
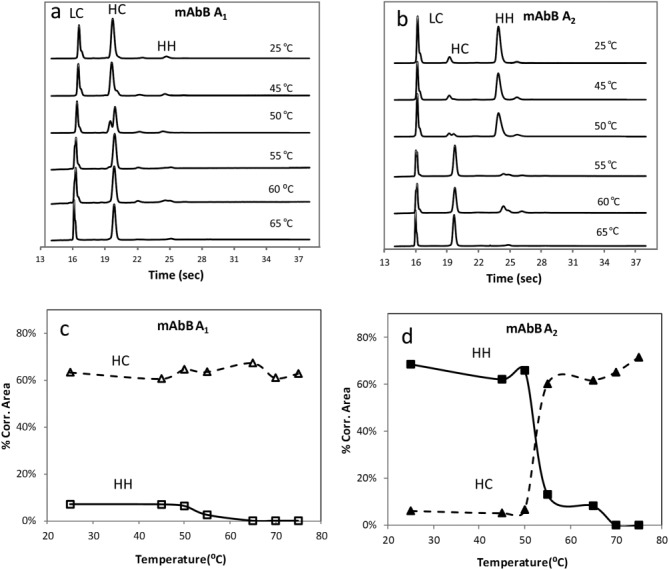
Micro fluidic chip-based CE-SDS electropherograms of reduced mAbB A1 (a) and mAbB A2 (b) at different temperatures; plots of peak areas of HH and HC versus temperatures for mAbB A1(c) and mAbB A2 (d).
Probing hinge disulfides by limited proteolysis
The thiol-dependent protease papain is often use to cleave human (and other mammalian) IgG1 into independent Fab and Fc domains under native conditions. Cleavage occurs on the N-terminal side of the heavy chain hinge cysteines between histidine 224 and threonine 225 (Eu numbering) in the protein sequence KTHTCPPCP. More recently, papain was also found to cleave human IgG2 molecules in the presence of the reducing agents cysteine and DTT.6 In this case, papain cleaves between heavy chain glutamate 222 and cysteine 223 in the hinge sequence KCCVECPPCP. If the cleaved IgG2 is then analyzed under denaturing conditions, three polypeptides are observed: full length LC, the reduced Fc fragment (Fc/2) and the Fab portion of the heavy chain (Fd). Because of this thiol reagent requirement, reduction in IgG2 cysteines 219 and 220 was thought necessary for cleavage. These two upper hinge cysteines are absent in IgG1s.
Papain digestions were used to explore the hinge region of the A2 isoform. Treated samples were then analyzed by nonreducing microfluidic chip-based CE-SDS. Results are shown in Figure 6. In the A1 enriched sample [Fig. 6(a)], three peaks, corresponding to reduced Fc (Fc/2), LC and Fd, were observed, as expected. Peaks were assigned based on theoretical masses. An A2 isoform enriched sample generated a different digestion pattern than the A1 isoform enriched one [Fig. 6(b) vs. 6(a)]. A new peak, (Fd)2, with an estimated molecular weight of ∼45 kDa is present, along with a much diminished Fd peak. This result suggests that the two Fab HC fragments are still linked in the papain digested A2 isoform enriched samples. To confirm the tentative (Fd)2 assignment, papain digested A1 and A2 isoform samples were analyzed by LC–TOF–MS. The results, including total ion current (TIC) chromatograms and mass spectra, are shown in Figure 7.
Figure 6.
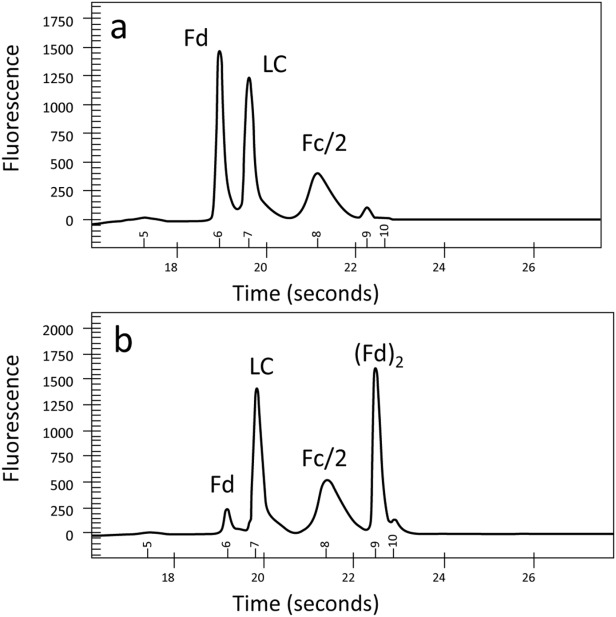
Micro fluidic chip-based CE-SDS electropherograms of enriched mAbB A1 (a) and mAbB A2 (b) after papain digestion.
Figure 7.
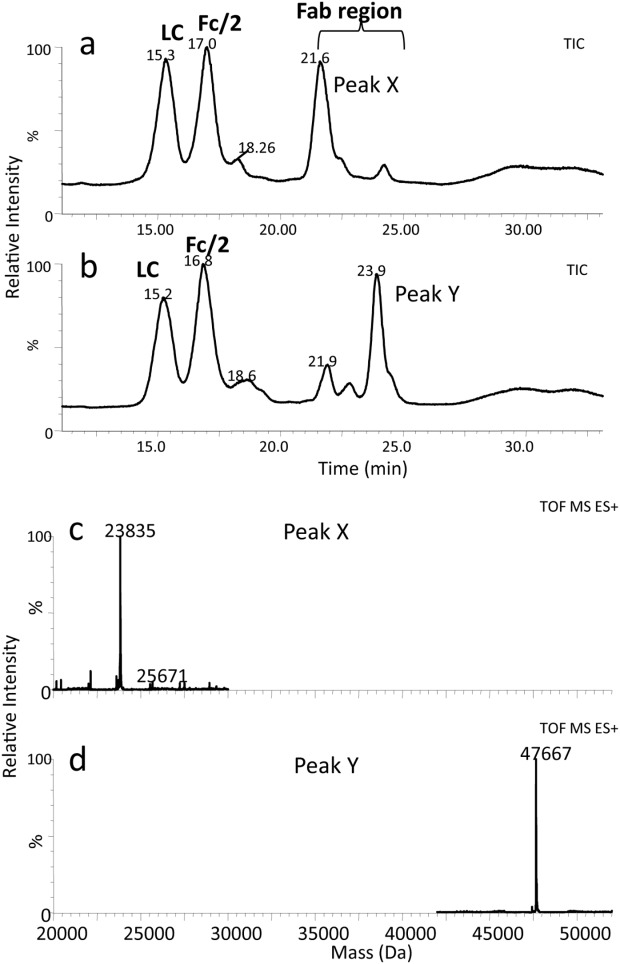
LC–MS results of enriched mAbB isoforms after papain digestion: (a) TIC of mAbB A1; (b) TIC of mAbB A2; (c) MS spectrum of Peak X; (d) MS spectrum of Peak Y.
Figure 7(a) and 7(b) display the TIC profiles of digested A1 and A2 isoform enriched samples. The LC and Fc/2 peaks were identified by mass. The observed masses for LC and Fc/2 for both samples are in agreement with the theoretical masses of LC (+1 NEM) and Fc/2 (+2 NEM) as listed in Table1. Following the LC and Fc/2 peaks in the chromatogram is a region (21–24 min) which displays differences between the papain-digested A1 and A2 isoform enriched samples. In the digested A1isoform-enriched sample [Fig. 7(a)] this region is dominated by a peak (Peak X) at 21.6 min. This peak has a mass consistent with the Fd region containing 3 NEM modifications [Fig. 7(c)]. The digested enriched A2 isoform sample [Fig. 7(b)], on the other hand, has a large peak in this region at 23.9 min (Peak Y) and only a small peak at 21.9 min. The peak Y mass [Fig. 7(d)] is consistent with (Fd)2 with six NEM modifications, as would be expected if the three cysteines in each Fab arm were reduced, but cysteines 219 and 220 in the upper hinge region remain linked to their pair cysteines in the other Fd. Nonreduced peptide mapping was performed on A1 and A2 isoform enriched samples to monitor the disulfide links. The peptide in the hinge region (C219-K244), called (H11-12)2 in reference 1, was completely reduced in the DTT treated A1 isoform enriched sample (H11-12) and contained 4 NEM adducts, as expected (not shown). In contrast, the DTT treated A2 isoform enriched samples had (H11-12)2 with a total of 4 NEM adducts. This result is consistent with a linked hinge in A2 isoform with 2 of the 4 hinge disulfides still intact. Some of the reduced H11-H12 with 4 NEM adducts was also present in the A2 isoform enriched sample, perhaps due to A1 isoform contamination. Taken together, the RP-HPLC and CE-SDS results suggest that the covalent linkage connecting the A2 isoform (Fd)2 fragment together is due to both of the upper hinge cysteines inability to reduce under these conditions. A1 and A2 isoforms differ in the accessibility of these upper two cysteines toward disulfide reduction. No difference was observed in the cysteines in the lower hinge region towards reduction. Additionally, A1 and A2 isoforms showed no difference in sensitivity toward an enzyme (IdeS) that cleaves below the lower hinge (data not shown). One can also conclude from these results that reduction of the upper hinge region is not necessary for papain to cleave human IgG2.
Table I.
Mass Analysis of Papain Digested mAbB
| Calc. mass (Da) | NEM (#/chain) | Calc. mass +NEM (Da) | Obs. mass +NEM (Da) | |
|---|---|---|---|---|
| LC | 23587.0 | 1 | 23712 | 23706 |
| Fd | 23461.2 | 3 | 23836.2 | 23835 |
| Fc/2 | 26170.9 | 2 | 26420.9 | 26418 |
| (Fd)2 | 46918.4 | 6 | 47668.4 | 47667 |
Study of mAbA insertion mutant
To further explore the structural nature of the IgG2- A2 form, an insertion mutant was made in mAbA. This mutation resulted in production of mAbA with a HC containing two additional prolines between Cys219 and Cys220 in the upper hinge. Thus, the wild-type (WT) hinge sequence of CCVECPPC became CPPCVECPPC. The peptide mapping analysis of the purified mAbA insertion mutant protein, expressed in CHO cells, revealed that it had only one main disulfide linkage pattern, similar to IgG2-A, greatly reducing molecule heterogeneity. This limited heterogeneity can also be seen in the nonreducing RP-HPLC profile, by comparing mAbA insertion mutant in Figure 8(a) with the wild-type mAbA in Figure 1(a). Incubating the mAbA insertion mutant under physiological redox conditions for two weeks, conditions which led to disulfide isoform changes in wild-type mAbA,5 did not significantly impact the RP-HPLC profile [Fig. 8(a)]. This result suggests that no disulfide isoform conversion occurred. However, unlike with the mAbA A2 isoform, the mAbA insertion mutant was sensitive to reduction of all the hinge cysteines under native conditions. After reduction with 10 mM DTT [Fig. 8(b), Time 0] only LC and HC peaks, and no HH peak, are observed by microchip based CE-SDS.
Figure 8.
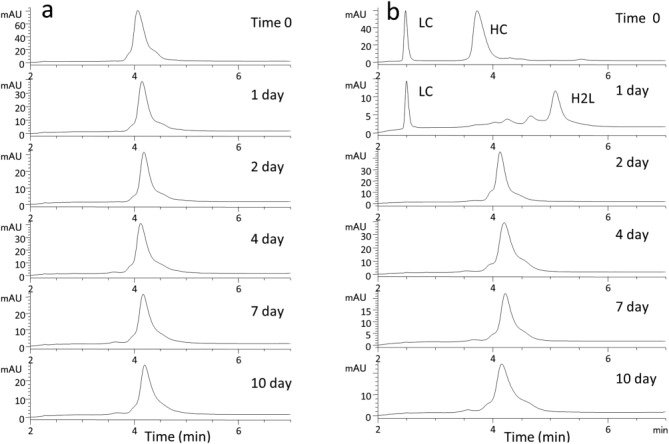
Chromatograms of mAbA insertion mutant (a) and reduced mutant (b) while incubating under physiological redox conditions. Times indicated are days under the physiological redox conditions.
Following reduction, the reduced mAbA insertion mutant protein was incubated under physiological redox conditions for 2 weeks. This “blood-like” redox condition of 15 µM cysteine and 250 µM cystine promotes reoxidation of the interchain disulfide bonds. A single peak, eluting at the original position of H2L2 emerges after 2 days [Fig. 8(b), 2 day] of dialysis. No shift in position was seen with longer incubations, which would indicate disulfide isoform conversion. Although all the interchain disulfide bonds on this insertion mutant protein are capable of reduction, only the A isoform is regenerated. Alternative linkages are not generated under conditions known to promote A1 → A/B → B conversion. Thus, the insertion of two prolines between Cys219 and Cys220 eliminates the reduction resistance of the A2 isoform and also prevents A/B and B formation. Positions of the cysteines in this region are clearly necessary for the structural behavior of the naturally occurring isoforms.
Probing for structural differences between A1 and A2 Isoforms by NMR
The fact that the IgG2-A2 cysteines 219 and 220 were greatly protected from reduction unless denaturing conditions were applied, suggests properties similar to the interior of a folded globular protein, not those of the canonical exposed flexible region of an antibody hinge. Protein segments surrounding these cysteines might be anticipated to reduce flexibility of the hinge and Fab arms dynamics. We therefore explored the antibody conformation and dynamics through NMR spectroscopy.
We have shown previously that 1H NMR spectroscopy can be used to assess structural similarity between two antibody molecules.7 Here we applied this approach (named PROFILE) to A1 and A2 isoforms in an effort to rationalize this drastically different chemical behavior of both molecules. It should be emphasized however that NMR observables in PROFILE correspond to the bulk proton magnetization, and the length scale is the entire protein molecule; structural details on the atomic level are beyond the reach of this approach.
The 1H spectra of mAbB enriched for the A1 and A2 isoforms are shown in Figure 9(a). Here the PROFILE methodology generates a highly resolved entire one-dimensional 1H spectrum of the “pure” monoclonal antibody (mAb).7 The subsequent subtraction of the featureless component of this spectrum yields a detailed fingerprint spectrum, suitable for spectral similarity calculations as described in Ref. (7). The PROFILE similarity measure of 0.93 indicates significant structural differences between the molecules. The analogous experiment with off-resonance field during the diffusion delay yielded even more dissimilar 1H NMR spectra with the similarity measure of 0.73 [Fig. 9(b)]. The off-resonance field acts here like a band-pass filter for protons experiencing intramolecular motions significantly faster than the overall tumbling. As a result a set of resonances in A1 isoform has been revealed which clearly corresponds to the antibody attached carbohydrate chains. These resonances are absent in the spectra of A2 isoform. Since both A1 and A2 isoforms showed virtually the same glycan profiles by LC–MS peptide mapping (Table2), it is conceivable that the major structural differences between both isoforms reside in the CH2 heavy chain domains. Thus in A1 isoform this portion of the protein could be more open, with carbohydrate chains more dynamic, while in A2 isoform the CH2 domain is more compact, as the attached glycans appeared to be immobilized, likely by stronger interactions with themselves and the protein.
Figure 9.
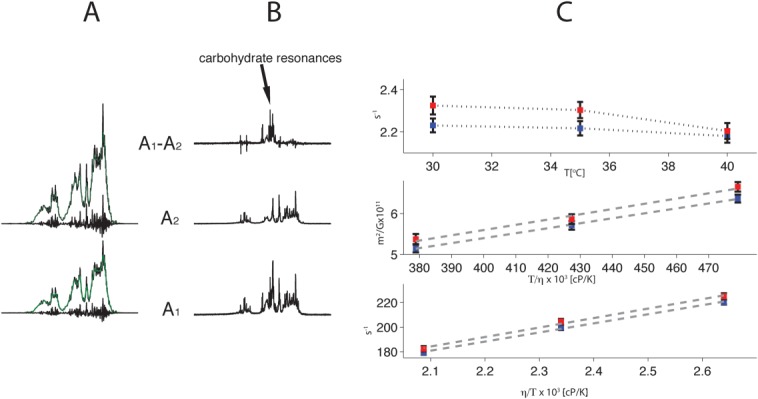
PROFILE (a) and R1ρ-PROFILE (b) spectra of mAbB A1 and A2 isoforms recorded at 42°C. The similarity measure rp is 0.93 and 0.78 for the spectra in A and B, respectively. The difference spectrum A1–A2 predominantly represents mobile carbohydrate chains of the A1 form. The decomposition of the PROFILE spectra into the contour and fingerprint components is shown in A. (c) HAP-NMR data for A1 (blue) and A2 (red) isoforms. The error bars correspond to standard errors. Viscosity values correspond to the tabulated values for water. The top, middle and bottom graphs correspond to values of R1, Dt and R2, respectively.
Table II.
Glycan Profiles of mAbB A1 and A2 Disulfide Isoforms
| Abundance (%) | ||
|---|---|---|
| Glycan | mAbB-A1 | mAbB-A2 |
| A1G0 | 2.1 | 1.8 |
| A1G0F | 5.5 | 5.7 |
| A1G1F | 1.4 | 1.8 |
| A1G1M4F | 1.3 | 1.6 |
| A1G1M5F | 1.0 | 1.2 |
| A2G0 | 2.1 | 2.2 |
| A2G0F | 40.8 | 42.6 |
| A2G1F | 11.9 | 13.5 |
| A2G2F | 2.8 | 2.5 |
| M5 | 20.6 | 18.8 |
| M6 | 3.5 | 3.0 |
| M7 | 1.8 | 1.8 |
| M8 | 1.4 | 1.2 |
A# refers to the number of antennae. G# refers to the number of terminal Gal residues. F is core fucosylation. M# are high mannose glycans or hybrid glycan with number of mannose residues listed.
To gain additional insight we explored the hydrodynamic differences between A1 and A2 isoform samples by HAP-NMR analysis.7 Here the transverse relaxation rate R2, translational diffusion coefficient Dt and longitudinal relaxation rate R1 profiles for 30–40°C temperature range are shown in Figure 9(c). In this temperature range R2 and Dt for A1 and A2 isoforms follow temperature dependent viscosity changes of water in good agreement with the Debye–Stokes–Einstein equations. Noticeably, the observed differences between A1 and A2 isoforms are small yet settled. For molecules of the size of an antibody the R2 process for proton spins is directly proportional to the correlation time for the overall tumbling τ0. In the presence of fast intramolecular motions (with correlation times much shorter than τ0) τ0 is scaled down by a factor which reflects spatial magnitude of these motions. The enhanced relaxation rates for mAbB-A2 versus -A1 and the concomitant differences in Dt, where A2 isoform appeared to be more compact than the A1 isoform (the effective hydrodynamic radius is smaller by ∼3%) are consistent with the reduced intramolecular motions in the A2 isoform, where the effective correlation time is ∼2% longer as compared to the A1 isoform. Although we do not anticipate significant differences in the viscosity and intermolecular interactions across both samples (both samples were measured at low and equal concentrations of ∼10 mg/mL), it is worthwhile to note that any such differences could not be reconciled with the observed R2 and Dt profiles. Furthermore, the distinct R1 values most likely reflect differences in the hydration of A1 and A2 isoforms, consistent with the observed different conformations and dynamics. Notably, the differences in HAP-NMR between A1 and A2 isoforms are similar, although much smaller in magnitude for R2 and R1, to the differences in HAP-NMR between IgG1 and IgG2 molecules in general (data not shown). Since the last pair is expected to have substantially different Fab arm dynamics) we speculate that the A2 isoform may have the diminished (relative to the A1 isoform) dynamics of the Fab arms as well.
Discussion
Human IgG2s have been shown to contain multiple disulfide-mediated structural isoforms that in some cases affect activity. In this paper, we have extended our understanding of these isoforms to an unusual subspecies of the A structural isoform. Unlike the A1 isoform, the major A disulfide-mediated structural isoform subspecies, A2 isoform is resistant to disulfide isoform conversion under physiological conditions. Studies with samples enriched in A1 and A2 isoforms described here show that the inability of the A2 isoform to convert to other disulfide-mediated structural isoforms is linked to its resistance to disulfide reduction. The hinge region of the A1 isoform and all other IgG2 isoforms studied reduce under relatively mild conditions, consistent with the well-established picture of a somewhat exposed flexible hinge region. In contrast, the A2 isoform requires treatment under conditions that are denaturing to proteins in order to reduce the upper hinge disulfides. Thus, the upper hinge of the A2 isoform behaves like an interior of a globular protein, not as expected for an IgG hinge region. We used 1H NMR to probe for dynamic differences in these subisoforms. Results suggest that the Fc glycan is more dynamic in the A1 than in A2 isoform and that small differences in the Fab arm conformation and dynamics may exist between these two subisoforms. In previous work, we have argued that concern over lot to lot variability in IgG2 disulfide isoform levels on recombinant antibody biotherapeutics are diminished somewhat by the interconverability of these forms in vivo. Such an argument would not be valid for the A2 disulfide isoform, which is unable to convert into other forms due to protection in the hinge region. Control of overall disulfide isoform levels may be a particular concern in biotherapeutics where the A2 isoform displays a significant activity difference.
Peptide mapping and Edman sequencing failed to identify any covalent differences between A1 and A2 disulfide isoforms. In both isoforms the hinge region is independent, lacking disulfide connections to the CH1 region. Interchain disulfide bond connections appear to be all parallel in nature. When exposed to higher temperatures (>55°C) the upper hinge disulfide could be fully reduced with thiol-based reagents. It seems that only differences in the noncovalent intramolecular interactions are at play.
If only noncovalent forces distinguish the A subisoforms, perturbations of these interactions might be expected to allow conversion of A1 isoform to A2 isoform, or vice versa. So far no conditions have been found which allow interconversion between A1 and A2 isoforms. Reduction and reoxidation of all the A1 isoform interchain disulfide bonds regenerates the A1 isoform (and allows conversion to A/B and B isoforms) but does not produce the A2 isoform (results not shown). Addition of 1M guanidine HCl to this reaction, conditions shown to promote A1 isoform formation also do not generate the A2 isoform. The harsher conditions used to reduce the A2 isoform so far have not allowed generation of A2 or A1 isoforms after reoxidation. One possible explanation might be found in the differences between the protein folding and assembly pathway followed in vivo and the disulfide interconversions that occur in vivo and in vitro. In antibody producing cells, the heavy chain assembles into a heavy chain-heavy chain dimer (HH) prior to the addition of the light chains.8 The CH1 domain of the heavy chain interacts with the ER chaperone BiP before LC addition, presumably to aid in this assembly process. Perhaps conformations in the HH allow the formation of the A2 state during this assembly process but are difficult to achieve in vitro with the bound LC in the fully assembled antibody.
Materials and Methods
Materials and instrumentation
Recombinant human IgG2 monoclonal antibodies, mAbA(IgG2κ), mAbB (IgG2κ), and mAbC (IgG2λ), were expressed in Chinese hamster ovary (CHO) cells and purified by standard manufacturing procedures.9 The IgG2-A1 and the IgG2-A2 disulfide isoforms could be enriched to about 90% purity using a combination of cation exchange chromatography5 and affinity chromatography on an antihuman IgG2 column using the mouse antihuman IgG. In general, the disulfide isoforms can be partially purified by cation exchange at low pH with a salt gradient.1 Further separation of the A1 and the A2 isoforms can be achieved using an affinity column with an antibody against IgG (HP6014). The A2 isoform does not bind whereas the A1 isoform can be enriched through a decreasing pH gradient. Details of this purification will be described elsewhere (Chou et al., submitted). ZORBAX 300SB-C8 (2.1 × 50 mm, 3.5 µm) columns were purchased from Agilent Technologies (Santa Clara, CA). ACQUITY UPLC BEH300 C4 Columns (2.1 × 150 mm, 1.7 μm particle) were obtained from Waters Corporation (Milford, MA). Spectra/Por Float-A-Lyzer G2 dialysis devices (3000 MWCO) were purchased from Spectrum Laboratories (Rancho Dominguez, CA). HyClone DPBS was obtained from Thermo Fisher Scientific (Waltham, MA). l-cystine, l-cysteine, and sodium azide (NaN3) were from MP Biomedical (Irvine, CA). Guanidine–HCl (GuHCl), dithiothreitol (DTT), and N-ethyl maleimide (NEM) were from Sigma-Aldrich (St. Louis, MO). Lysyl endopeptidase (Lys-C) was from Wako Chemicals, USA (Richmond, VA). Papain was obtained from Roche (Indianapolis, IN). HT Protein Express LabChip kits, including chips and reagents, were purchased from Caliper Life Sciences (Mountain View, CA). All organic solvents were of analytical or HPLC grade.
Antibody disulfide reduction under nondenaturing conditions
Antibodies were treated with reductant under nondenaturing conditions by incubating at 2 mg/mL with 2 mM DTT in 50 mM Tris–HCl, pH 7.5 at ambient temperature. After 2 h, free thiols were reacted with NEM (25 mM final concentration). Nonreducing microchip based CE-SDS (Caliper LC-90) was performed to measure the level of interchain disulfide reduction.10
Incubations under physiological blood plasma redox conditions
Antibody samples were incubated under redox conditions using a flow-through dialysis system, as described previously.5,11 Approximately, 1.0 mL of each mAb (0.2 mg/mL) was loaded into individual Float-A-Lyzer G2 dialysis tubes and placed into the dialysis chamber. The chamber was then incubated at 37°C in a buffer which had been mixed by a chromatography system to generate PBS, pH 7.4 with 15 µM cysteine and 250 µM cystine. At each time point, an aliquot was mixed with a buffer to achieve a final concentration of 5 mM NEM, 5 mM sodium acetate, 5% sorbitol, at pH 5.0.
Antibody fragmentation by papain
Antibody samples at 1 mg/mL were treated with papain in 0.1M Tris–HCl (pH 7.6), 4 mM EDTA, 5 mM cysteine, and 10 mM DTT. The protein to enzyme ratio was 100 to 1 (w/w). The reaction proceeded for 2 h at 37°C. The reaction was quenched with 35 mM NEM final concentration for 30 minutes before analysis.
Nonreducing RP-HPLC analysis
Nonreducing RP-HPLC was performed on an Agilent 1100 HPLC System with a ZORBAX 300SB-C8 column. Mobile phase A was 5% n-propyl alcohol and 0.11% TFA. Mobile phase B was 90% n-propyl alcohol, and 0.1% TFA. The chromatography conditions were as described previously.5
Microchip-based nonreducing CE-SDS analysis
Microchip-based capillary electrophoresis-sodium dodecyl sulfate (CE-SDS) was performed on a Caliper LC90 (Caliper Life Sciences) under nonreducing condition. The assay was described previously,10 with the following modifications. A total of 5 μL of sample at approximately 1 mg/mL was mixed with 30 μL of HT Protein Express Sample Buffer (Caliper Life Sciences) and 60 μL 8 mM NEM (final concentration of 5 mM NEM). The samples were incubated at 75°C for 10 min prior to the analysis by LC90 with the “HT Protein Express 200” program.
Intact mass LC–MS analysis
Approximately 5–10 µg of protein were analyzed using an LCT electrospray time-of-flight mass spectrometer (Waters, Milford, MA) coupled with an Agilent 1100 HPLC system. A reverse phase column Poros R1/10 column (4.6 × 50 mm) was used for protein separation. Mobile phase A was 0.1% trifluoroacetic acid (TFA) in water; mobile phase B was 0.1% TFA in 90% acetonitrile/10% water. Chromatography was performed at a flow rate of 0.2 mL/min at 75°C, and monitored at UV 280 nm. The gradient was: 0 min, 30% B; 30 min, 50% B; 46 min, 90% B; then hold at 90% B for 4 min.
Edman sequencing of disulfide-linked hinge peptides and Lys-C peptide mapping
A1 and A2 disulfide isoforms were purified under denaturing conditions using the nonreducing RP-HPLC method. UV peaks containing A1 or A2 isoforms were fractionated using an Agilent 1100 fraction collector system. A more detailed description of the procedure can be found elsewhere.1 Briefly, fractions were collected from multiple chromatography runs into a solution containing sufficient guanidine HCl to generate a final concentration of 6M for each fraction, a condition which is denaturing for the antibody. Immediately after collection, the fraction was exchanged into a buffer containing 4M urea, 20 mM NH2OH, 0.1M sodium phosphate, pH 7.0. The proteolytic digestion reaction was carried out with endoproteinase Lys-C (enzyme to substrate ratio 1:10) at 37°C overnight. The digested samples were then separated using a RP-HPLC column (ACQUITY UPLC BEH300 C4) with a 0.2 mL/min flow rate at 65°C. Mobile phase A was 0.1% TFA in water and mobile phase B was 0.1% TFA and 90% acetonitrile. The gradient was initiated at 2% B and ramped to 25% B in 5 min, then to 42% B at 100 min. The hinge peptides of A1 and A2 isoforms were collected from multiple injections (50 µg/injection) using the Agilent 1100 fraction collector system. A portion of the isolated peptides were reinjected to confirm purity. The LC-MS conditions were the same as described in a previous paper.5
N-terminal protein sequencing by Edman degradation was performed on an Applied Biosystems Procise 494 protein sequencer (Foster City, CA). Aliquots of IgG2-A1 or -A2 hinge peptide in 0.1% TFA and acetonitrile were each loaded on to a polybrene-treated glass fiber filter and dried using argon gas. Briefly, the free N-terminus of a protein or peptide was coupled with phenylisothiocyanate (PITC) under basic conditions. Following sequential cleavage of the coupled product with trifluoroacetic acid (TFA), the phenylthiohydantoin (PTH)-derivatized amino acids were then chromatographically separated and detected by UV. This process was sequentially repeated in an automated fashion to yield the primary sequence of peptides IgG2-A1 and -A2. The picomolar recovery of each PTH-amino acid was determined by comparing the UV peak area to the area of a 10 pmol standard of each PTH-amino acid. Di-PTH-cystine (disulfide linked Cys) is not one of the typical amino acid standards, however it is known to elute at the same retention time as PTH-Tyr.12 The standard values of PTH-Tyr were therefore used for di-PTH-cystine.
NMR methods
Both mAbB A1 and A2 isoforms were prepared in 20 mM sodium phosphate buffer at pH 7. For the PROFILE and R1ρ-PROFILE spectra the concentrations of A1 and A2 were 9.7 and 13.9 mg/mL, respectively.7 For the H-PROFILE experiments A1 and A2 isoforms were at equal concentrations of 9.7 mg/mL. All NMR samples were prepared at 180 µL volume containing 5% D2O in 4 mm Shigemi tubes.
All experiments were performed on a Bruker Avance III spectrometer (Bruker BioSpin, Billerica, MA) operating at 800.13 MHz for proton using a TCI cryogenic probe. The PROFILE spectra were recorded with the PGSTE experiment as previously described,7 where the duration and the strength of bipolar gradients were 1 ms and 56.6 G/cm, respectively, the diffusion delay was 130 ms. For the R1ρ-PROFILE experiments the diffusion delay was replaced by 150 ms off-resonance irradiation in the form of two 75 ms trapezoidal pulses with 4% ramp times applied at ±60 kHz offsets from the carier frequency placed at the water resonance. The effective off-resonance field was 62.4 kHz with a 16° tilt angle to the B0 field. The correlation coefficients rp were calculated as described.7
The HAP-NMR (Hydrodynamic Analysis of Proteins by NMR) analysis was based on recording protein spectra for 11 different combinations of the PGSTE pulse sequence parameters: bipolar gradients strength and length, bipolar gradient recovery time, and diffusion delay (L. Poppe, unpublished results). Spectral intensities were obtained by numerical integration of the contour spectra. The R1, R2, and Dt parameters and their standard deviations were obtained from the least-squares solution to 55 ratiometric equations using Matlab 12a (MathWorks, Inc.) programming environment.
Glossary
- RP-HPLC
reversed phase-high performance liquid chromatography
- NaN3
sodium azide, GuHCl, guanidine–HCl
- DTT
dithiothreitol
- NEM
N-ethyl maleimide
- CE-SDS
capillary electrophoresis-sodium dodecyl sulfate
- H or HC
IgG heavy chain
- L or LC
IgG light chain
- IgG1
IgG2: IgG subclasses 1 and 2
- IgG2ĸ
IgG2λ, IgG2 with ĸ or λ light chain, respectively
- IgG2-A (A)
IgG2-A1 (A1), IgG2-A2 (A2), IgG2-B (B), IgG2-A/B (A/B), disulfide isoforms of IgG2 antibodies
- mAbA
mAbB, mAbC, monclonal antibody A, B, and C
- mAbA A1
mAbA A2: A1 and A2 isoforms of antibody A
References
- Wypych J, Li M, Guo A, Zhang Z, Martinez T, Allen MJ, Fodor S, Kelner DN, Flynn GC, Liu YD, Bondarenko PV, Ricci MS, Dillon TM, Balland A. Human IGG2 antibodies display disulfide mediated structural isoforms. J Biol Chem. 2008;283:16194–16205. doi: 10.1074/jbc.M709987200. [DOI] [PMC free article] [PubMed] [Google Scholar]
- Dillon TM, Ricci MS, Vezina C, Flynn GC, Liu YD, Rehder DS, Plant M, Henkle B, Li Y, Deechongkit S, Varnum B, Wypych J, Balland A, Bondarenko PV. Structural and functional characterization of disulfide isoforms of the human IGG2 subclass. J Biol Chem. 2008;283:16206. doi: 10.1074/jbc.M709988200. [DOI] [PMC free article] [PubMed] [Google Scholar]
- Zhang B, Harder AG, Connelly HM, Maheu LL, Cockrill SL. Determination of Fab-hinge disulfide connectivity in structural isoforms of a recombinant human immunoglobulin G2 antibody. Anal Chem. 2010;82:1090–1099. doi: 10.1021/ac902466z. [DOI] [PubMed] [Google Scholar]
- Liu YD, Chen X, Enk JZ, Plant M, Dillon TM, Flynn GC. Human IgG2 antibody disulfide rearrangement in vivo. J Biol Chem. 2008;283:29266–29272. doi: 10.1074/jbc.M804787200. [DOI] [PMC free article] [PubMed] [Google Scholar]
- Liu YD, Wang T, Chou R, Chen L, Kannan G, Stevenson R, Goetze AM, Jiang XG, Huang G, Dillon TD, Flynn GC. IgG2 disulfide isoform conversion kinetics. Mol Immunol. 2013;54:217–226. doi: 10.1016/j.molimm.2012.12.005. [DOI] [PubMed] [Google Scholar]
- Yan B, Eris T, Yates Z, Hong RW, Steen S, Kleemann G, Wang W, Liu JL. Analysis of human antibody IgG2 domains by reversed-phase liquid chromatography and mass spectrometry. J Chromatogr B Analyt Technol Biomed Life Sci. 2009;877:1613–1620. doi: 10.1016/j.jchromb.2009.03.043. [DOI] [PubMed] [Google Scholar]
- Poppe L, Jordan JJ, Lawson K, Jerums M, Apostol I, Schnier P. Profiling formulated monoclonal antibodies by 1H NMR spectroscopy. Anal Chem. 2013;85:9623–9629. doi: 10.1021/ac401867f. [DOI] [PubMed] [Google Scholar]
- Feige MJ, Groscurth S, Marcinowski M, Shimizu Y, Kessler H, Hendershot LM, Buchner J. An unfolded CH1 domain controls the assembly and secretion of IgG antibodies. Mol Cell. 2009;34:569–579. doi: 10.1016/j.molcel.2009.04.028. [DOI] [PMC free article] [PubMed] [Google Scholar]
- Shukla AA, Hubbard B, Tressel T, Guhan S, Low D. Downstream processing of monoclonal antibodies—application of platform approaches. J Chromatogr B Analyt Technol Biomed Life Sci. 2007;848:28–39. doi: 10.1016/j.jchromb.2006.09.026. [DOI] [PubMed] [Google Scholar]
- Chen X, Tang K, Lee M, Flynn GC. Microchip assays for screening monoclonal antibody product quality. Electrophoresis. 2008;29:4993–5002. doi: 10.1002/elps.200800324. [DOI] [PubMed] [Google Scholar]
- Jiang XG, Wang T, Kaltenbrunner O, Chen K, Flynn GC, Huang G. Evaluation of protein disulfide conversion in vitro using a continuous flow dialysis system. Anal Biochem. 2013;432:142–154. doi: 10.1016/j.ab.2012.09.027. [DOI] [PubMed] [Google Scholar]
- Grant GA, Crankshaw MW. Identification of PTH-amino acids by HPLC. Methods Mol Biol. 2003;211:247–268. doi: 10.1385/1-59259-342-9:247. [DOI] [PubMed] [Google Scholar]


