
Figure 8.
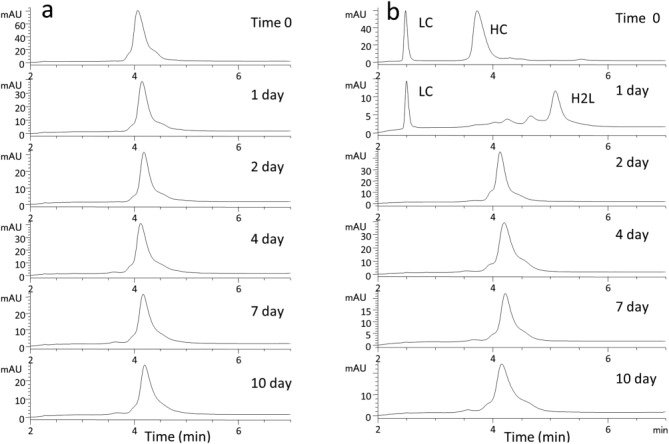
Chromatograms of mAbA insertion mutant (a) and reduced mutant (b) while incubating under physiological redox conditions. Times indicated are days under the physiological redox conditions.
Official websites use .gov
A
.gov website belongs to an official
government organization in the United States.
Secure .gov websites use HTTPS
A lock (
) or https:// means you've safely
connected to the .gov website. Share sensitive
information only on official, secure websites.
Chromatograms of mAbA insertion mutant (a) and reduced mutant (b) while incubating under physiological redox conditions. Times indicated are days under the physiological redox conditions.