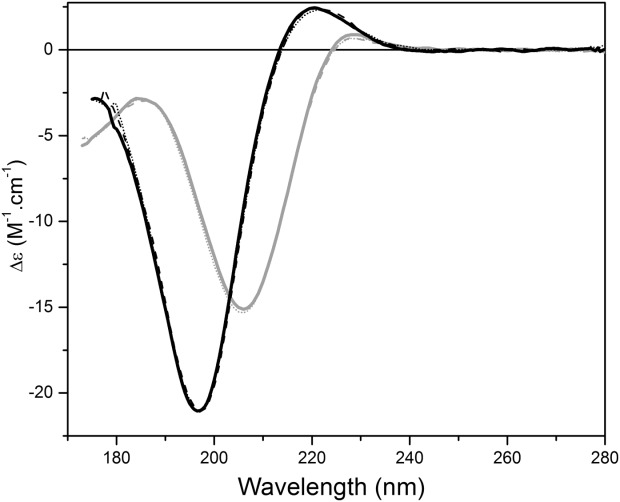
Figure 1.

Spectral characteristics of native polyproline and collagen, and effects of pH treatment. SRCD spectra of polyproline (gray) and collagen (black) in 10mM sodium phosphate buffer (pH 7.0) (solid), in 10mM sodium phosphate pH 2.6 (dashed), and 10mM sodium borate buffer pH 10.0 (dotted).
