
Figure 4.
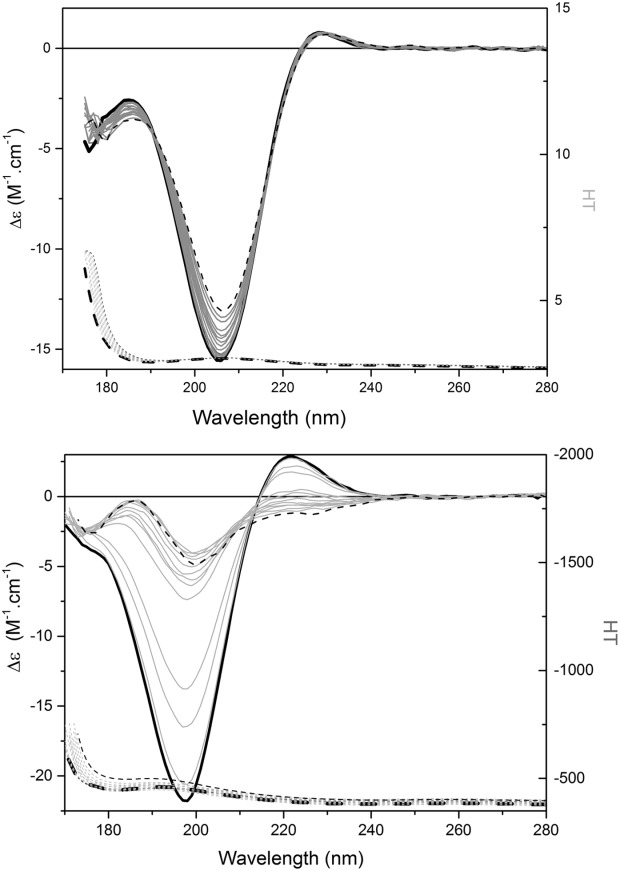
The effects of thermal unfolding. SRCD spectra of (a) polyproline and (b) collagen, at temperatures ranging from 10 to 85°C in steps of 5°C. Black solid lines indicate the spectra for 10°C, dashed for 85°C, and the gray spectra are for the intermediate temperatures. The corresponding HT curves are shown in the lower part of each panel.