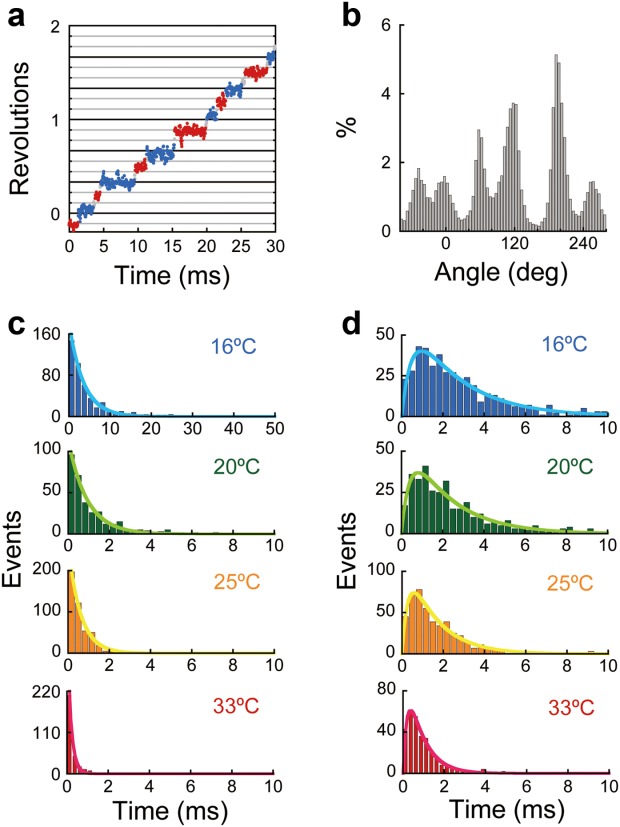
Figure 3.

Dwell time analysis of F1-ATPase. (a) Time course of the rotation of F1 in the presence of 200 µM ATP at 16°C. The pauses before the 80° or 40° substeps are shown as blue or red, respectively. (b) Histogram of angular positions from the time course shown in Figure 3(a). (c) Histograms of the dwell times of the pause before the 80° substep at 16°C (blue), 20°C (green), 25°C (orange), and 33°C (red). Curves were plotted using a first-order reaction scheme, y = C·exp(−k·t), where k (16°C) = 287 s−1, k (20°C) = 1098 s−1, k (25°C) = 1654 s−1, and k (33°C) = 5540 s−1. (d) Histograms of the dwell times of the pause before the 40° substep at 16°C (blue), 20°C (green), 25°C (orange), and 33°C (red). Curves were plotted using a sequential reaction scheme, y = C·(exp(−k1·t) −exp(−k2·t)), where k1 (16°C) = 420 s−1, k1 (20°C) = 491 s−1, k1 (25°C) = 710 s−1, k1 (33°C) = 1332 s−1, k2 (16°C) = 2085 s−1, k2 (20°C) = 2500 s−1, k2 (25°C) = 3507 s−1, and k2 (33°C) = 5009 s−1.
