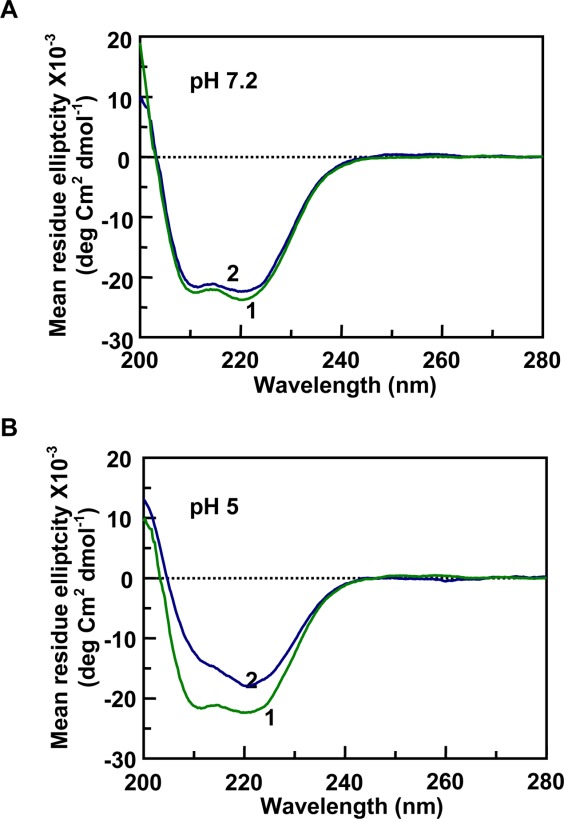
Figure 4.

Secondary structural changes observed by CD spectra of the moPrP 121–231 fragment in the presence of gcDNA. In A and B (pH 7.2 and pH 5, respectively), trace-1 represents the protein in buffer (moPrP 121–231; 20 µM), showing two characteristic peaks for α-helix at 222 and 208 nm. In the presence of the nucleic acid ([Nucleotide]/[PrP]) = 4), there is no significant effect on the protein secondary structure at neutral pH (A, trace-2,). However there is a substantial reduction of the CD intensities at the peaks observed at pH5 (B, trace-2) where reduction in the CD intensity at 222 nm reduced to a lesser extent than the peak at 208 nm.
