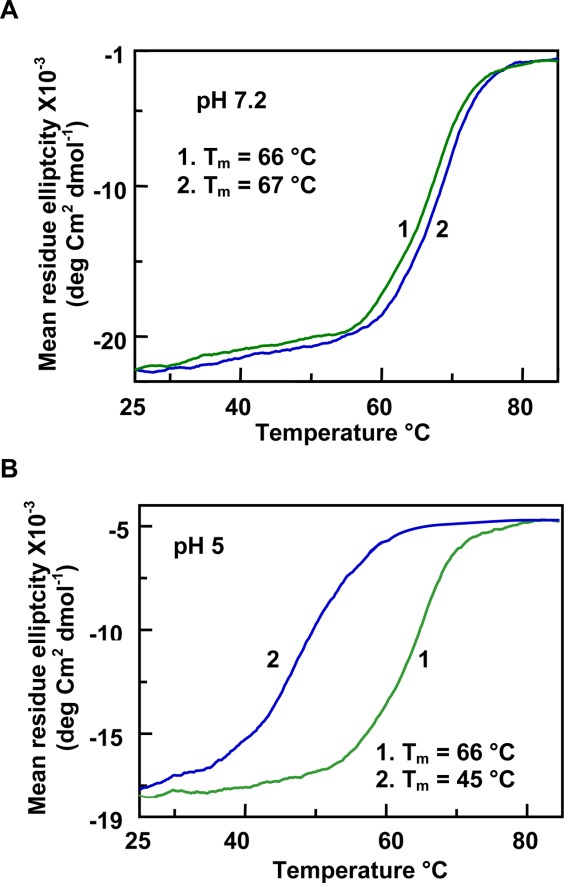
Figure 5.

Effect of tRNA on the thermal unfolding of moPrP (121–231) monitored at pH 7.2 (A) and pH 5 (B). The change in the CD intensity was measured at 222 nm. In both figures, trace 1 represents the protein in buffer and trace 2 represents the protein in the presence of 1 µM tRNA. Nucleotide to protein concentration ratio was 4. It can be seen that the structural transition of the protein fragment is broader at pH 5.
