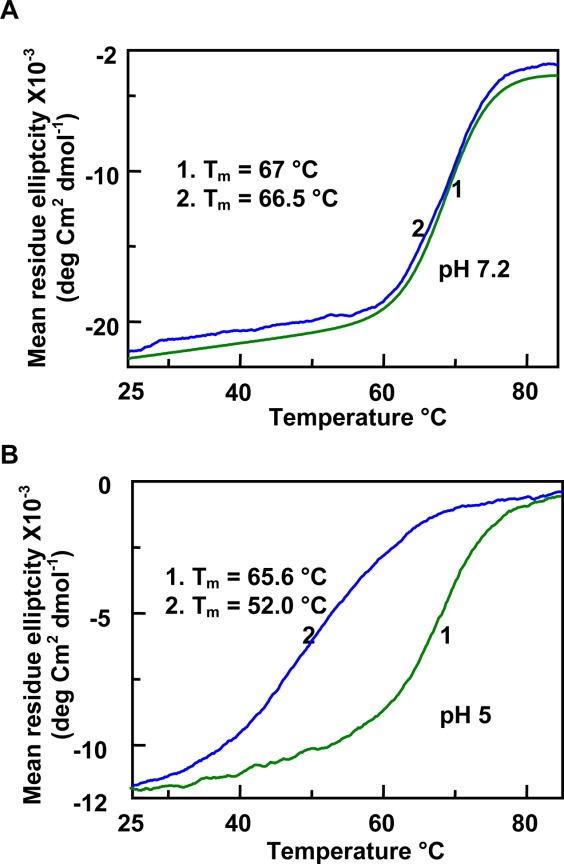
Figure 6.

Effect of gcDNA on the thermal unfolding of moPrP (121–231) monitored at pH 7.2 (A) and pH 5 (B). The change in the CD intensity was measured at 222 nm. In both figures, trace 1 represents the protein in buffer and trace 2 represents the protein in the presence of gcDNA. Nucleotide to protein concentration ratio was 4. It can be seen that the structural transition of the protein fragment is broader at pH 5.
