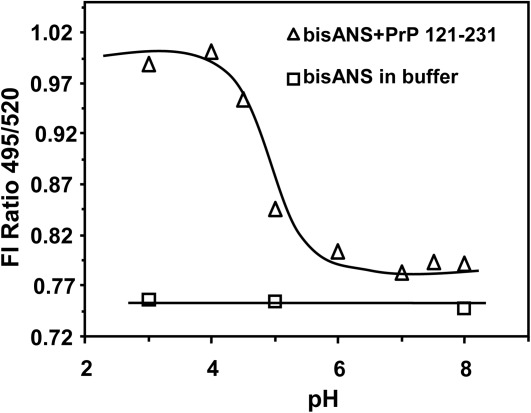
Figure 9.

pH dependence of the fluorescence intensity of bis-ANS in the presence of moPrP (121–231) (triangle). In the experiment the protein (2 µM) was mixed with bis-ANS (8 µM) at different pH. After 30 min of incubation the individual spectrum was taken and the fluorescence intensity ratios at 495–520 nm at different pHs were plotted as a function of pH. The fluorescence intensities of bis-ANS remain between the pHs indicated (square).
