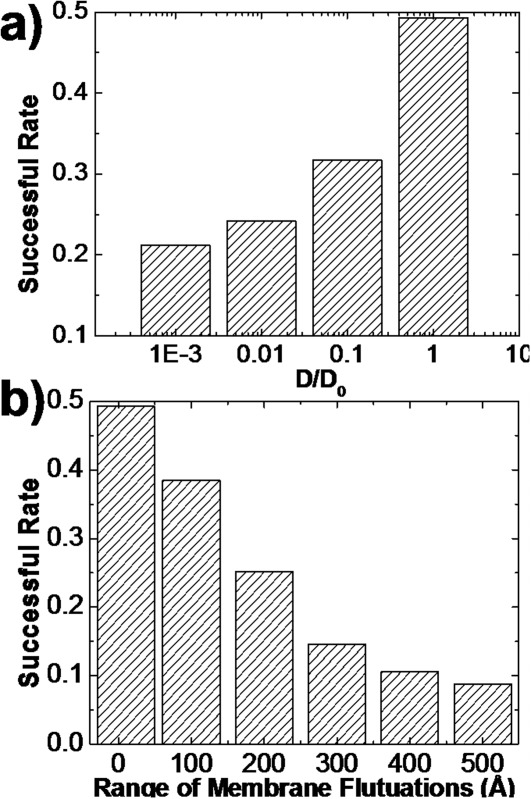
Figure 5.

The relation between successful rate of 2D association and diffusion constant is plotted in (a). The x axis is the ratio between testing value and original value of diffusion constant (D/D0). The figure suggests that slower diffusions of membrane proteins decelerate their associations. Furthermore, the relation between successful rate of 2D association and total range of membrane fluctuations is plotted in (b). This figure indicates that 2D associations of membrane proteins are impeded by larger fluctuations of cell membranes.
