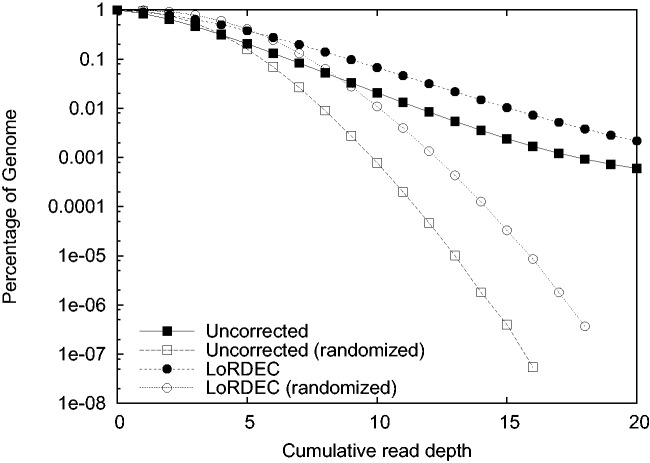
Fig. 4.
Percentage of the parrot genome covered by raw and corrected reads in function of read depth. The percentages (y-axis in log scale) are plotted for the true alignments (in black) and when considering the alignments are uniformly distributed over the genome (in white). Raw reads are represented by square and corrected reads by circles. The curves for corrected reads dominate that of raw reads, as correction increases the number of reads mapped. The black curves adopt similar shapes, suggesting that correction is not seriously impacted by repeats; their distances to the white curves suggest that a bias related to genomic location is already present in the raw reads

