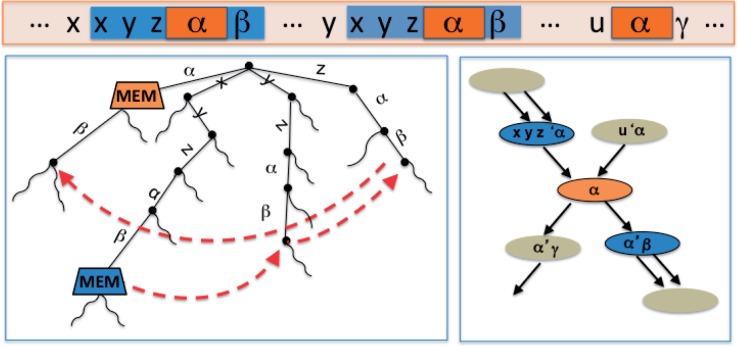
Fig. 3.
Part of the suffix tree for a genome (left) with the corresponding part of the compressed de Bruijn graph (right). Two MEMs in the suffix tree and the suffix links that are followed to decompose the larger MEM to at least three repeat nodes, the purple nodes in the graph on the right. x, y and z are characters. α, β and γ are strings. Suffix links are displayed in red

