
Fig. 5.
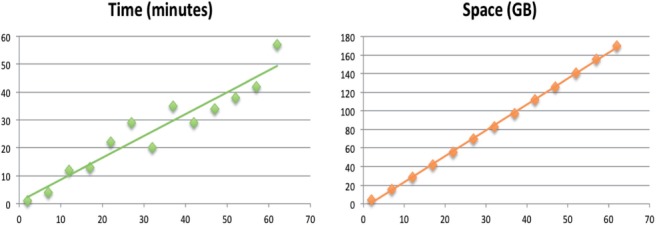
The running time and peak memory of splitMEM on the pan-genome graphs of increasing numbers of E.coli strains with k-mer length of 25. Each point represents the minimum value recorded over five trials to reduce measurement noise introduced by competing activity of the server. The line represents the linear regression of the points