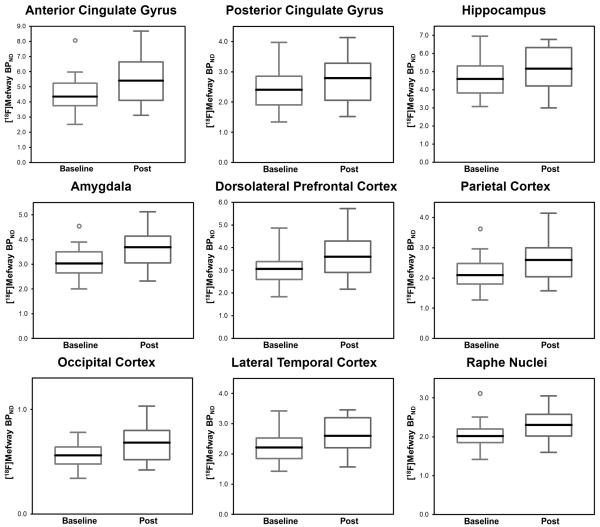
Figure 2.
Boxplots of 5-HT1A BPND in the regions of interest. Left, in blue, shows baseline BPND, while right, in red, shows post-drinking BPND. ○ indicates outliers. Statistically significant differences were observed in all regions except the raphe nuclei, where a trend (P=0.059) was observed. Note the different scales for each panel. Solid center lines indicate the medians. Each boxplot was composed of data from 14 subjects.

