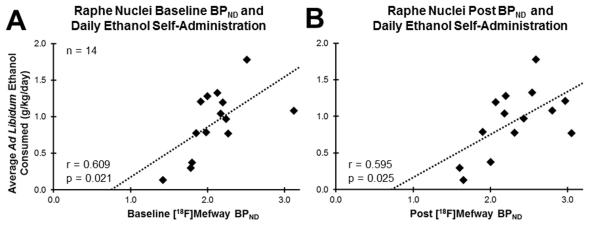
Figure 3.
Relationship between 5-HT1A BPND in raphe nuclei and ethanol-self administration (g/kg/day). Panel A shows baseline BPND while panel B shows post BPND. Pearson”s correlation coefficients (r) and correlation significance (p) are shown in each panel, bottom left, along with the line fit (dashed line).

