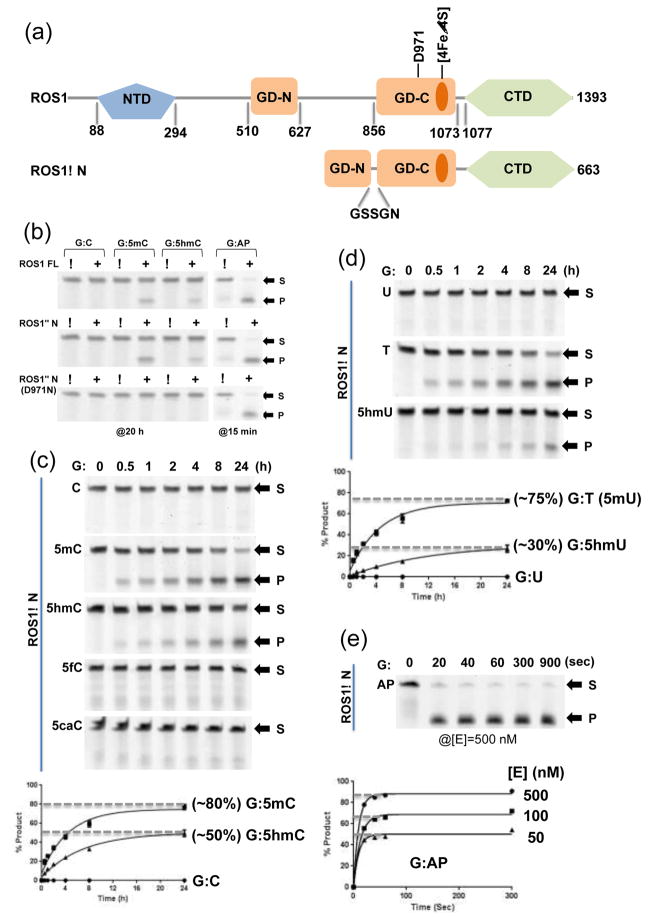
Figure 1. ROS1 glycosylase domain (GD) and the C-terminal domain (CTD).
(a) Domain organizations of ROS1 full-length (FL) and ROS1ΔN.
(b) Activities of ROS1 FL (top panel), ROS1ΔN (middle panel), and ROS1ΔN D971N (bottom panel) on 32-bp oligos for indicated time under the single-turnover condition ([SDNA]=50 nM and [EFL]=100 nM or [EΔN]=100 nM or [ED971N]=500 nM). Labels S for substrate and P for product.
(c) The time course (0–24 h) of ROS1ΔN reactions ([EΔN]=500 nM) on five oligos ([SDNA]=50 nM) with various modifications under the single-turnover condition. Data (± error bars) were averaged from three independent experiments (n=3).
(d) The time course (0–24 h) of ROS1ΔN reactions ([EΔN]=500 nM) on three oligos with G:X mismatches ([SDNA]=50 nM). Data (± error bars) were averaged from three independent experiments (n=3).
(e) The time course (0–15 min) of ROS1ΔN AP lyase reactions (under three enzyme concentrations) on oligo ([SDNA]=50 nM) with an AP site.

