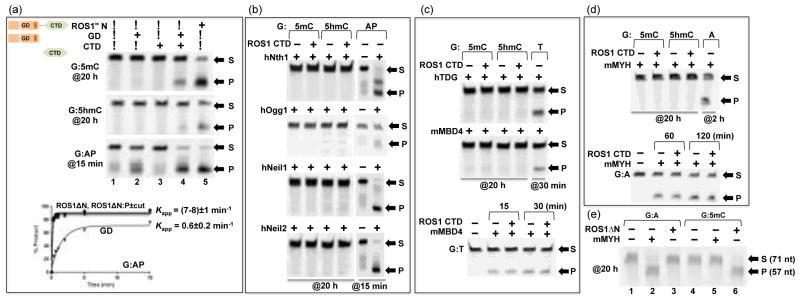
Figure 2. Effect of C-terminal domain (CTD) on ROS1 glycosylase domain (GD) activity.

(a) Activities of ROS1ΔN ([EΔN]=0.5 μM), the glycosylase domain ([EGD] ≈ 0.5 μM), and the C-terminal domain ([ECTD] ≈ 1.5 μM) on 32-bp oligos ([SDNA]=50 nM) at 20 h (G:5mC and G:5hmC) or 15 min (G:AP) reactions. Bottom panel: The time course of AP lyase activities of ROS1ΔN, ROS1ΔN:P (with and without the protease cleavage), and GD.
(b) Bifunctional DNA glycosylases, with and without ROS1 CTD ([ECTD] ≈ 1.5 μM), on G:5mC and G:5hmC 32-bp oligos ([SDNA]=50 nM) at 20 h reactions. AP lyase activities (15 min; 1 h for hOgg1) under the same condition are shown as positive controls. The enzyme concentrations used were 0.1 μg μl−1 of hNth158, 1.6 U of hOGG1 (New England Biolabs, catalog #M0241), and 50 ng μl−1 of hNeil159 and hNeil260.
(c) The glycosylase domains of hTDG7 and mMBD431 ([E]=500 nM), with and without ROS1 CTD ([ECTD] ≈ 1.5 μM), on G:5mC and G:5hmC 32-bp oligos ([SDNA]=50 nM) at 20 h reactions. Activities on G:T mismatch (30 min) under the same condition are shown as positive controls. Bottom panel: the activity of mMBD4 on G:T substrate is unaffected by the addition of ROS1 CTD.
(d) mMYH ([E]=500 nM), with and without ROS1 CTD ([ECTD] ≈ 1.5 μM), on G:5mC and G:5hmC 32-bp oligos ([SDNA]=50 nM) at 20 h reactions. Activities on G:A mismatch (2 h) under the same condition is shown as a positive control. Bottom panel: the activity of mMYH on G:A substrate is unaffected by the addition of ROS1 CTD.
(e) mMYH or ROS1ΔN ([E]=500 nM) on 71-bp oligos from the mouse IL-2 promoter34 ([SDNA]=50 nM) at 20 h reactions. mMYH is only active on G:A mismatch (lane 2), while ROS1ΔN is active on G:5mC (lane 6) under the same condition.
