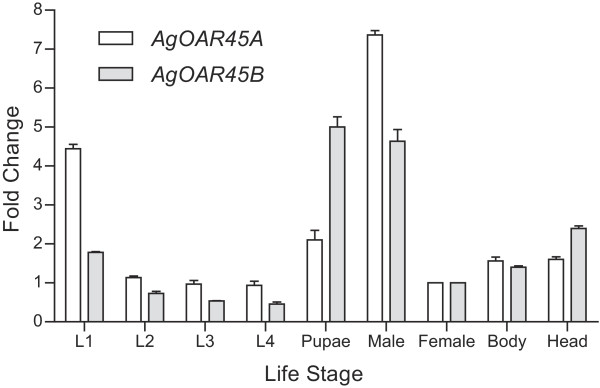
Figure 2.

Expression levels of AgOAR45A and AgOAR45B. Quantitative PCR analysis of An. gambiae AgOAR45A (grey) and AgOAR45B (white) at different life stages, including larvae (L1-L4), pupae, whole body adult females and males, adult female heads and thorax/abdomen. Data are expressed as fold change relative to whole females. Means ± SD of three independent experiments are presented.
