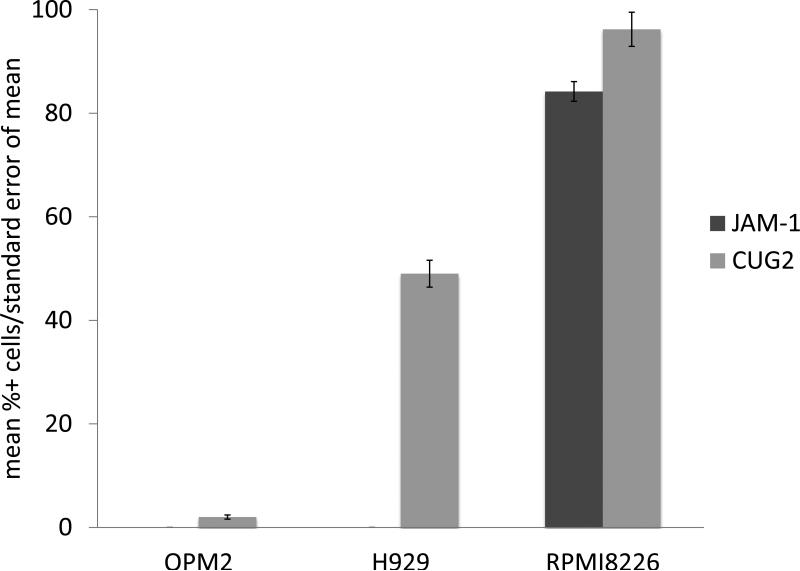
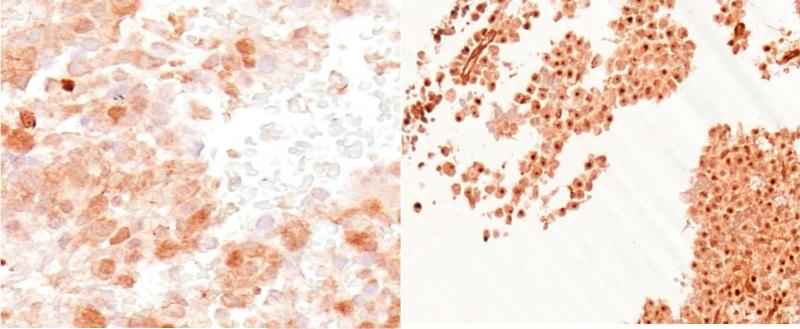
Figure 3. Co-expression analyses of JAM-1 and CUG2.
JAM-1 and CUG2 expression were analyzed in resistant (OPM2), intermediately resistant (H929), and sensitive (RPMI-8226) MM cell lines at MOI 25 (3a). JAM-1 was present in the sensitive cell line only. CUG2 expression was higher in sensitive MM cell lines. Immunohistochemical analysis of CUG2 (3b) utilizing Leica Bond Max shows a representative CUG2 negative (left) sample, and a CUG2 positive patient sample (right). CUG2 expression analysis in two melanoma cell lines (DO4 and CHL) shows that CUG2 expression increases in both cell lines with the addition of paclitaxel (3c).


