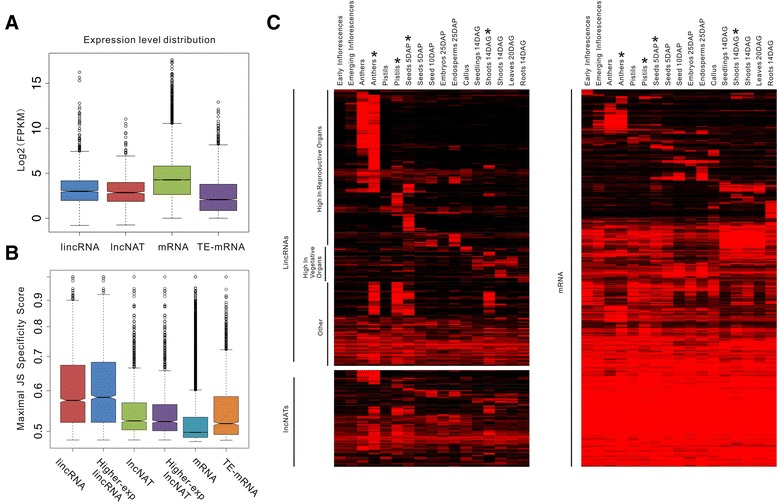
Figure 3.

Developmental and tissue-specific expression of lncRNAs. (A) lincRNAs and lncNATs are expressed at lower levels than protein-coding genes but at higher levels than TE-mRNAs. FPKM, fragments per kilobase of exons per million fragments mapped. (B) The maximal JS (Jensen-Shannon)specificity score distributions for all lincRNAs, highly expressed lincRNAs, lncNATs, highly expressed lncNATs, protein-coding genes and TE-mRNAs. (C) The abundance of all of the expressed lincRNAs and lncNATs (left panel) and protein-coding genes (right panel) across 17 stages/tissues. The rows and columns were ordered according to CLICK. The asterisks marked the four strand-specific whole transcriptome sequencing datasets.
