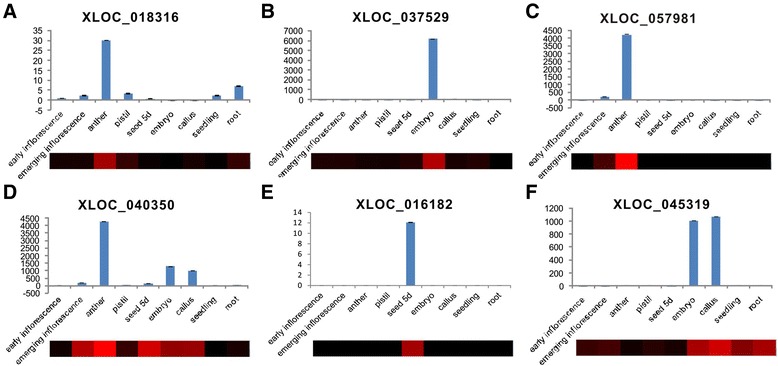
Figure 4.

Confirmation of the expression patterns of lncRNAs using quantitative RT-PCR. (A-F) The expression pattern of four multi-exonic lncRNAs (A-D) and two single-exon lncRNAs (E,F). A heatmap of each lncRNA was generated from the FPKM values and used to visualize the lncRNA expression patterns in the RNA-seq data. The values shown are the means ± standard deviation of n =3 replicates. Actin2 was used as the reference gene.
