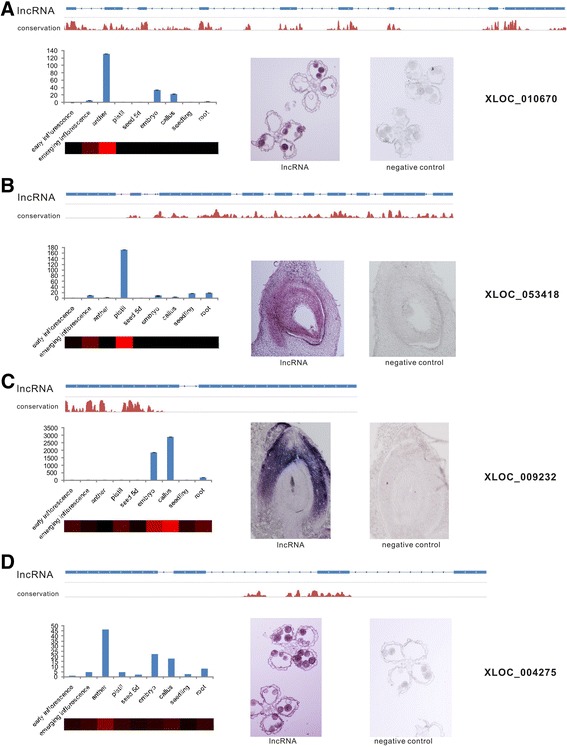
Figure 5.

Expression pattern and spatial expression pattern analysis of four conserved lncRNAs based on qRT-PCR and in situ hybridization. (A-D) The top part of each panel shows the conservation of a particular lncRNA; the lower left of each panel shows the expression pattern of the lncRNA based on qRT-PCR, and the lower right of each panel shows the spatial expression pattern in sperm (A,D) coleoptile (B) or ovule (C) of the particular lncRNA examined by in situ hybridization. The antisense transcript of each lncRNA was used to detect the expression of corresponding lncRNAs by in situ hybridization, and the antisense transcripts of lncRNAs that were not expressed in the corresponding organs were used as a negative control. A heatmap of each lncRNA was generated from the FPKM values and was used to visualize the lncRNA expression patterns in the RNA-seq data. The values shown are the means ± standard deviation (n =3 replicates). Actin2 was used as the reference gene.
